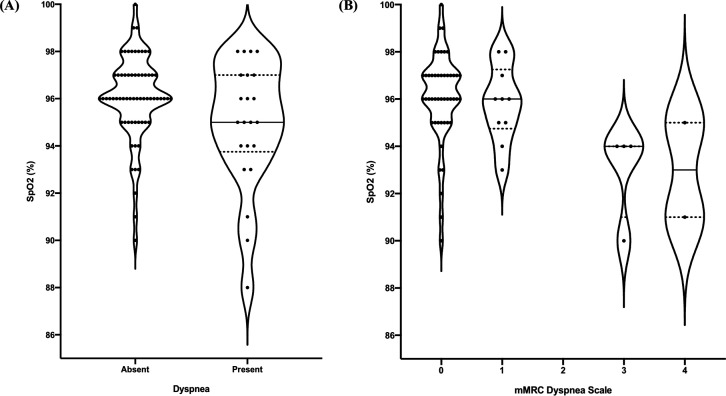
Figure 1.
Comparison of SpO2 and measures of subjective dyspnoea. (A) Violin plots showing the distribution of SpO2 (%) values in COVID-19 outpatients who reported dyspnoea and those who did not. (B) Violin plots showing the distribution of SpO2 (%) values in COVID-19 outpatients with various mMRC dyspnoea scale scores. The width of each plot is proportional to the number of patients with the respective SpO2 (represented by black dots). The median SpO2 is indicated by the central horizontal black line and the dotted lines correspond to the IQR. mMRC, modified Medical Research Council; SpO2, oxygen saturation.

