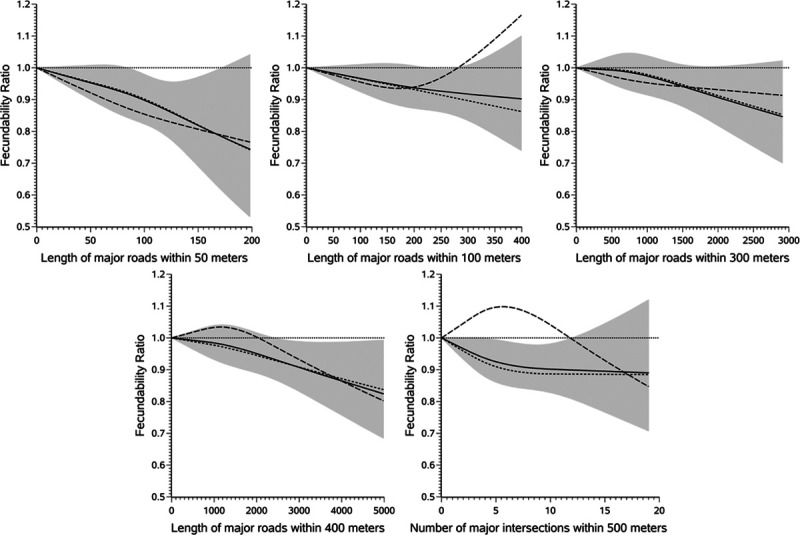
Figure 2.

Restricted cubic spline analysis examining the association between density of major roads around the residence and fecundability. The short dashed lines represent the fecundability ratios (FRs) for women residing in the United States. The long dashed lines represent FRs for women from Canada. The solid line represents FRs pooled across the two countries, and the shaded area indicates the 95% confidence band for the pooled data. The reference value for all splines is 0 (in other words, no major roads within the buffer). We included three knots in each spline at the 10th, 50th, and 90th percentile for the pooled data. All splines are adjusted for age, race/ethnicity, income, education, BMI, physical activity, smoking, sugar-sweetened soda intake, HEI score, multivitamin/folic acid intake, parity, intercourse frequency, doing something to improve chances of conception, census tract median household income, census tract % with less than a high school education, and census tract % non-Hispanic White.
