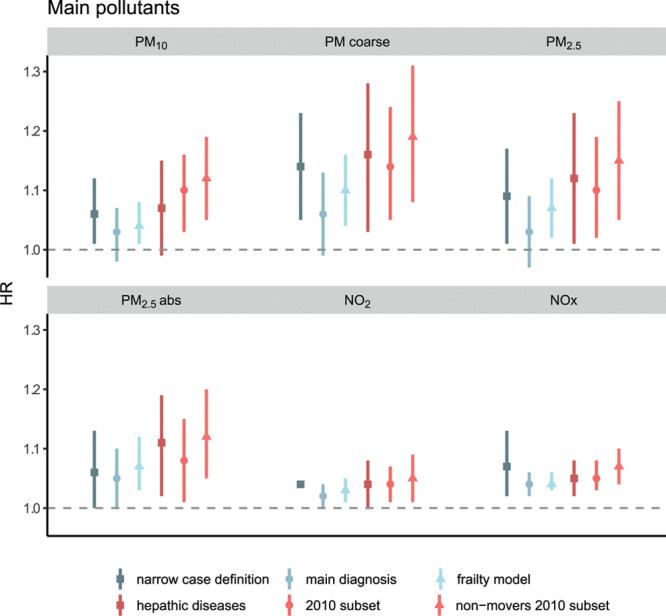
Figure 1.

Adjusted hazard ratios (HRs) and 95% confidence intervals (95% CI) for the association between main pollutants and liver cirrhosis according to six secondary analyses. Models adjusted for educational level, occupational status, marital status, place of birth, area-level SEP and stratified by sex and age as the time scale. Hazard ratios per fixed increments of pollutants: PM10, 10 µg/m3; PM coarse, 10 µg/m3; PM2.5, 5 µg/m3; PM2.5abs, 1 × 10⁻⁵/m; NO2, 10 µg/m3; NOx, 20 µg/m3.
