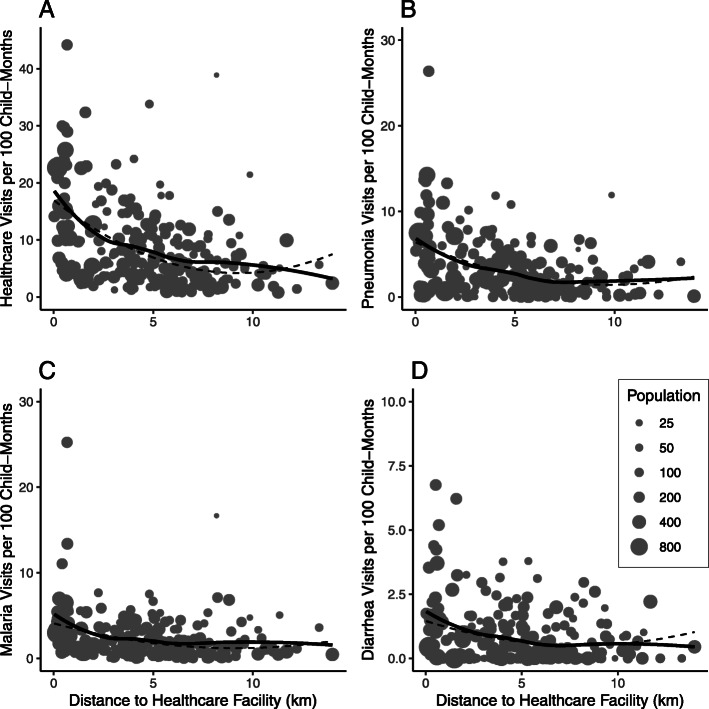
Fig. 1.
Community-level rate of overall (a) and cause-specific (b-d) clinic visits per 100 child-months by distance in kilometers from the community to the primary healthcare facility. Specific diagnoses include pneumonia (b), uncomplicated malaria (c), and non-bloody diarrhea (d). Grey dots indicate individual communities sized by the community’s population of children aged 0–59 months based on the most recent census. Solid black lines indicate a loess curve and dashed black lines indicate a polynomial fit curve from a quadratic regression model

