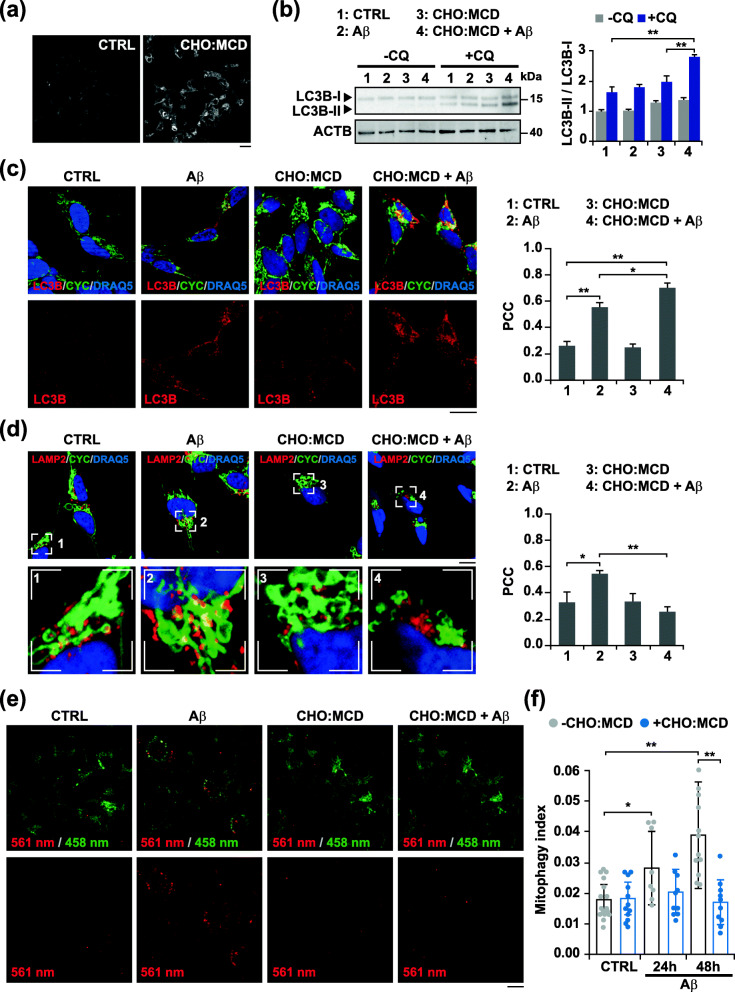
Fig. 1.
Cholesterol-enrichment in SH-SY5Y cells enhances Aβ-induced mitophagosomes formation while impairing mitochondrial clearance by lysosomes. Cells were incubated with a complex of cholesterol:methyl-β-cyclodextrin (CHO:MCD) containing 50 μg/ml cholesterol during 1 h followed by 4 h of recovery. a Filipin staining of unesterified cholesterol. Representative images of the increased fluorescence after CHO:MCD treatment (n = 3). Scale bar: 25 μm. b Representative immunoblots of cell extracts showing LC3B levels. To assess changes in the autophagy flux, cells were treated with chloroquine (CQ, 10 μM). Densitometry values of the bands were normalized to values of the corresponding ACTB/actin β bands and expressed as LC3B-II/LC3B-I ratio (n = 3). See Supplementary Figure 16 for uncropped blots. c and d Representative confocal images of control (CTRL) and cholesterol-enriched cells after treatment with Aβ (10 μM) for 24 h, and double immunostained with antibodies for LC3B (red) and CYC (green) (c) and for LAMP2 (red) and CYC (green) (d). The Pearson’s correlation coefficient (PCC) was calculated from 3 independent experiments (at least 6 random fields were analyzed per condition). Nuclei were counterstained with DRAQ5 (blue). Insets show a 3-fold magnification of the indicated regions. Scale bar: 25 μm. e Dual-excitation ratiometric imaging of mt-mKeima. Representative confocal images of control and cholesterol-enriched cells stably expressing mt-mKeima after Aβ (10 μM) incubation for 48 h. The emission signal obtained after excitation with the 458 nm laser is shown in green, and that obtained after excitation with the 561 nm laser is shown in red. Scale bar: 25 μm. f Mitophagy index calculated from 3 independent experiments (at least 10 random fields were analyzed per condition). One-way ANOVA. *P < 0.05; **P < 0.01 (data are mean ± SD)

