Fig. 3.
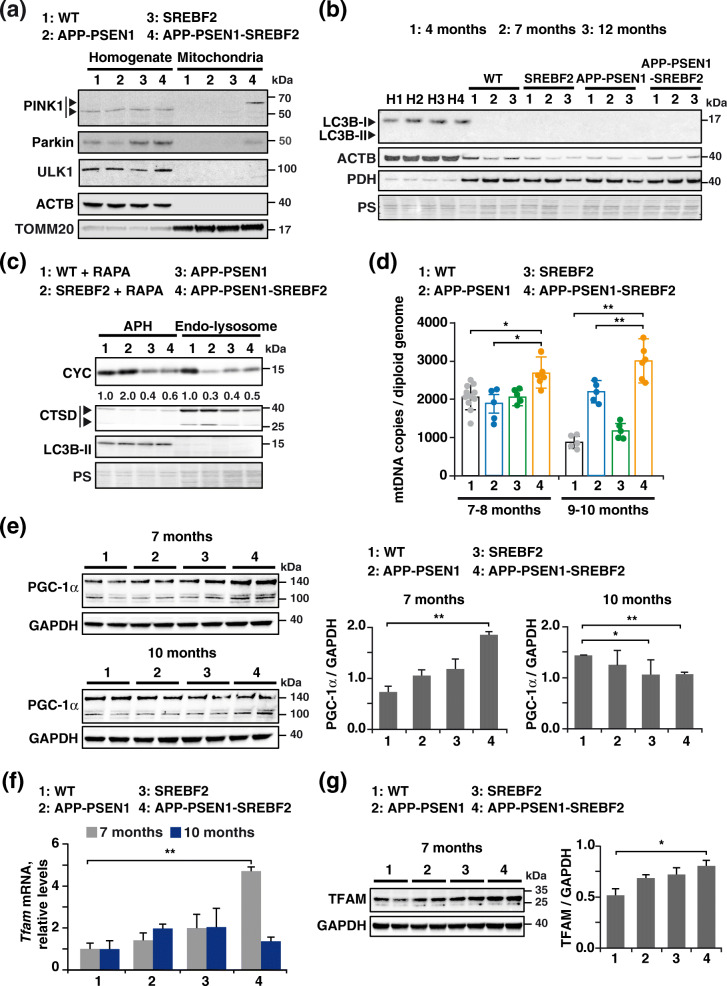
APP-PSEN1-SREBF2 brains show mitophagy impairment with disrupted recruitment of core proteins for mitophagosome synthesis that leads to mitochondria accumulation. a Western blot analysis of PINK1, parkin, and ULK1 in homogenates and the mitochondrial fraction of brains from 8-month-old WT (wild-type) and the indicated transgenic mice. Arrows in the PINK1 blot indicate the mature (52-kDa) and full-length (62-kDa) form. ACTB/actin β and TOMM20 levels were used as protein loading control in homogenates and mitochondria samples, respectively. b Immunoblot analysis of LC3B levels in mitochondria isolated from brains of WT and the indicated transgenic mice from 4 to 12 months of age. H1-H4: homogenate from 9-month-old WT (1), SREBF2 (2), APP-PSEN1 (3), and APP-PSEN1-SREBF2 (4) mice. c Western blot analysis of CYC in autophagosome (APH) and endo-lysosomes isolated from brains of 8-month-old WT and the indicated transgenic mice. To induce mitophagy, WT and SREBF2 mice were treated with rapamycin (RAPA, 5 mg/kg, i.p.) for 24 h. All densitometry values were first normalized to Ponceau S (PS) staining to adjust for protein loading. Then, values of CYC bands were normalized to the values of the corresponding LC3B-II (autophagosomes) or mature CTSD (lysosomes) bands. CTSD: Cathepsin D, intermediate (40 kDa) and mature (25 kDa) forms. d Quantification of mitochondrial DNA (mtDNA) in the hippocampus from WT and the indicated transgenic mice analyzed by range of age. mtDNA copy numbers were normalized to the copy number of Bax and Gsk3β genes as a mean of total diploid genome (n = 5–11 per range of age and genotype). e Expression levels of PGC-1α in total brain extracts. f Tfam mRNA expression in the hippocampus from WT and the indicated transgenic mice. Transcripts copies were expressed as relative levels referred to the expression in WT mice (n = 6). g Western blot analysis of TFAM in total brain extracts. e and g Densitometric values of the bands representing the specific protein immunoreactivity were normalized to the values of the corresponding GAPDH bands (n = 6). One-way ANOVA. *P < 0.05; **P < 0.01 (data are mean ± SD). See Supplementary Figure 17 for uncropped blots

