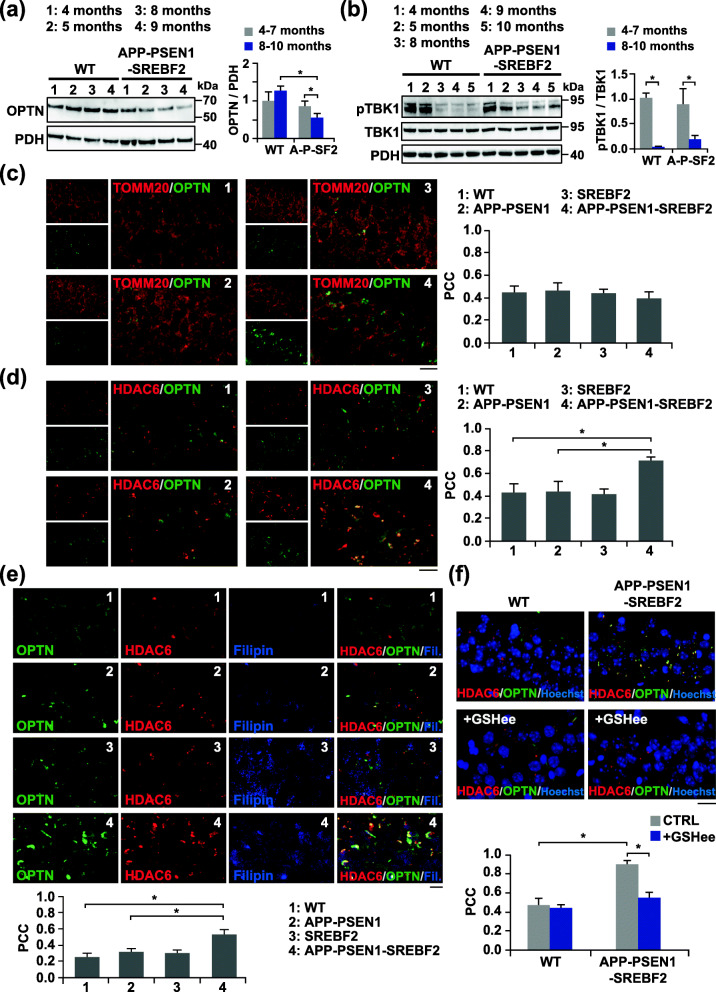
Fig. 5.
Reduced recruitment of OPTN to mitochondria that correlates with oxidative-induced OPTN-positive aggresomes in old APP-PSEN1-SREF2 mice. a and b Representative immunoblots of OPTN levels (a) and the protein levels of TBK1 and its phosphorylated form (pTBK1) (b) in the mitochondrial fraction isolated from brain extracts of WT and APP-PSEN1-SREBF2 mice at increasing ages. Densitometry of the bands representing specific protein immunoreactivity was assessed from samples grouped in the indicated range of age and values were normalized to the corresponding PDH values. pTBK1 values were normalized to TBK1 values. (n = 4 per range of age and genotype). A-P-SF2: APP-PSEN1-SREBF2 mice. See Supplementary Figure 19 for uncropped blots. c-f Hippocampal slices from 10-month-old WT and the indicated transgenic mice. Shown are photomicrograph of OPTN (green) and TOMM20 (red) immunoreactivity (c) or OPTN (green) and HDAC6 (red) immunoreactivity (d-f) with filipin staining (e). To recover the mitochondrial GSH content, mice were treated with 1.25 mmol/kg of GSH ethyl ester (GSHee) every 12 h for 2 weeks. Nuclei were counterstained by bisBenzimide Hoechst 33258 (blue). Scale bars: 25 μm. The Pearson’s correlation coefficient (PCC) was calculated from 3 independent experiments (at least 4 random fields were analyzed per condition). One-way ANOVA. *P < 0.05; **P < 0.01 (data are mean ± SD)

