
Fig. 2.
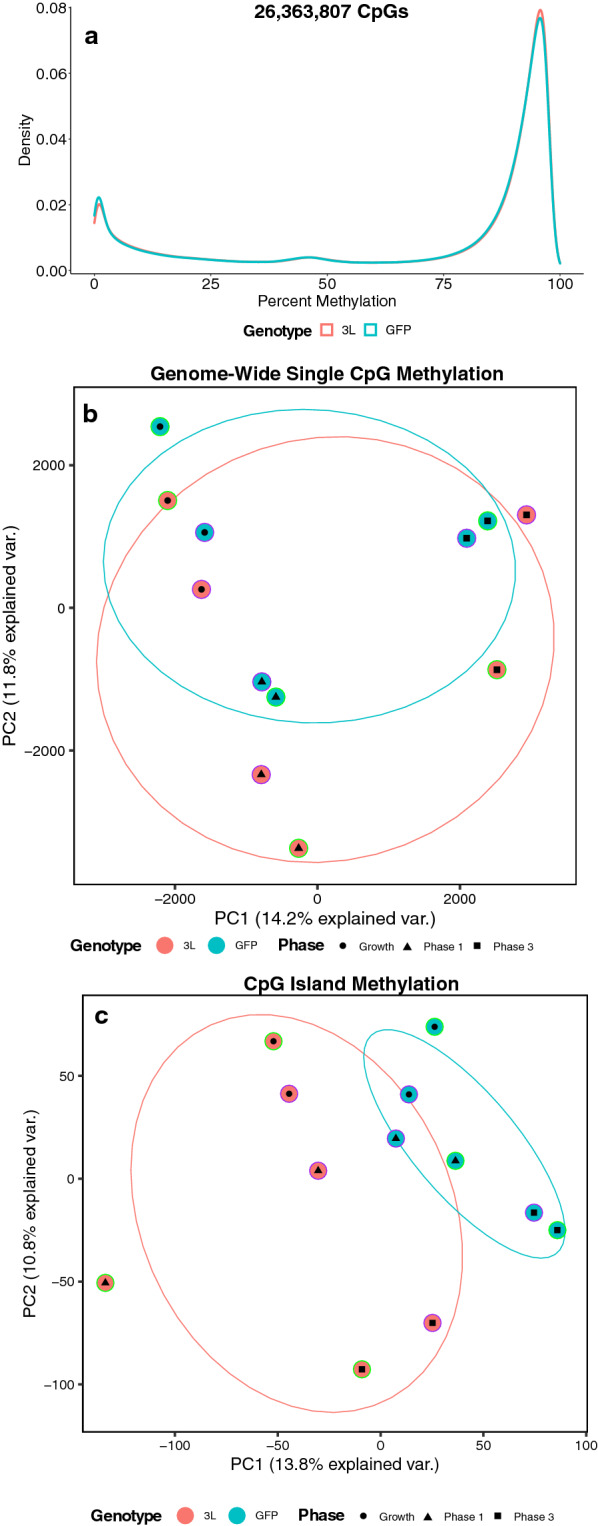
Global methylation profiles of DNMT3L overexpression. a Density plots of the mean of smoothed individual CpG methylation values for each cell line at the different phases. b Principal component analysis (PCA) of smoothed individual global CpG methylation values. c PCA of smoothed individual CpG island methylation values. For each PCA, the color of the outermost shape represents the cell line, where green represents the first batch of cell lines and purple represents the second. The ellipses represent the 68% confidence interval, which represents 1 standard deviation from the mean for data with a normal distribution