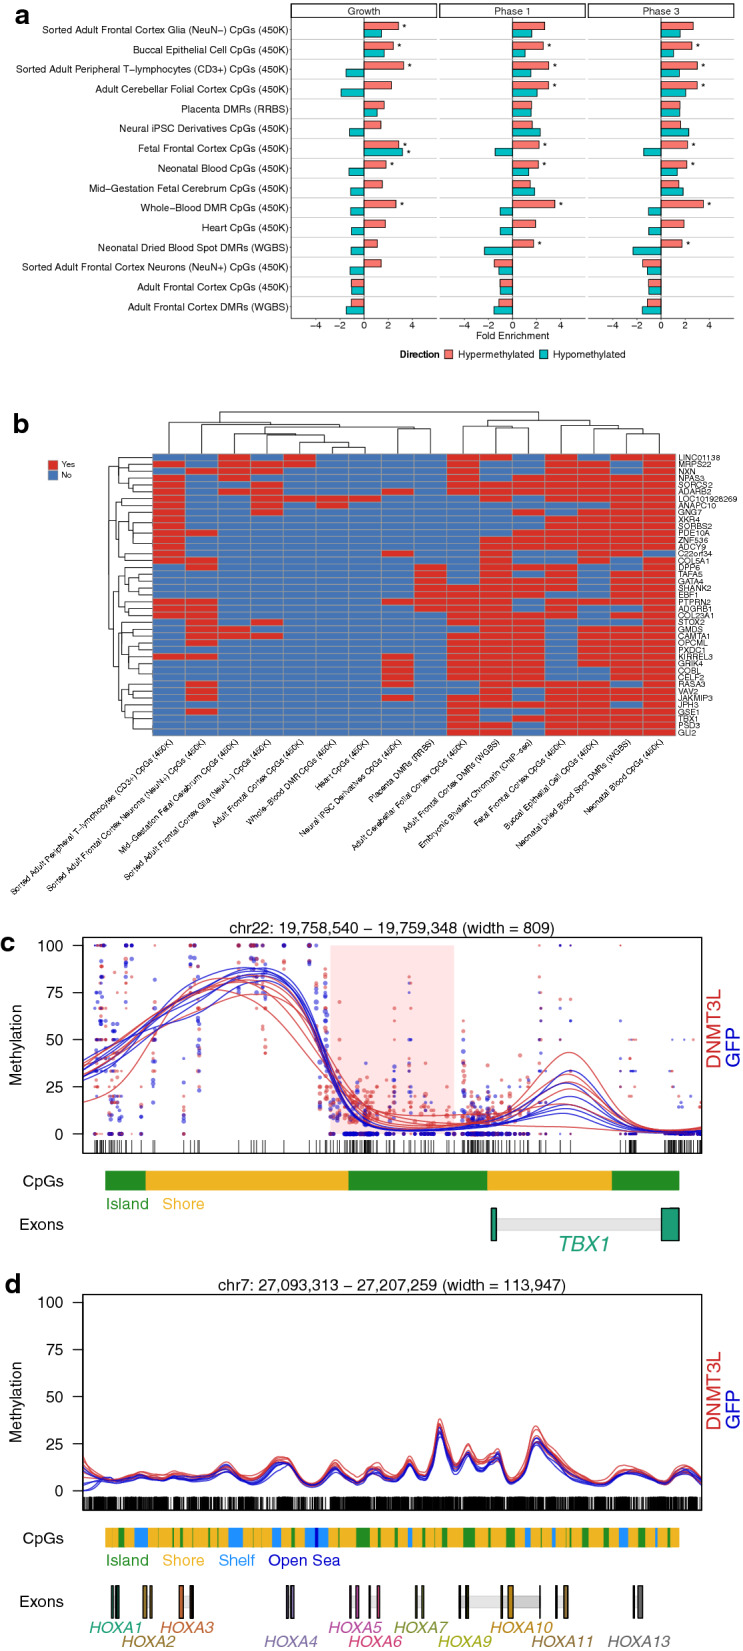
Fig. 7.

Enrichments of previously reported Down syndrome differentially methylated loci among the DNMT3L overexpression DMRs at each phase of neural differentiation. a Bar plots of enrichments of Down syndrome differentially methylated loci among the DNMT3L DMRs, shown for each of the available Down syndrome methylation datasets. The enrichments are relative to background regions. * = q < 0.05. b Heatmap (hierarchal clustering) of pan-tissue Down syndrome differentially methylated genes (DMRs in at least 5 datasets from previous studies), color coded for concordance or lack of concordance with the differential methylation produced by DNMT3L overexpression in SH-SY5Y neuroblastoma cells. Intergenic mappings were excluded. c Plot of the DNMT3L overexpression DMRs within the TBX1 promoter region. Samples at each phase of neural differentiation have been color coded by genotype. The dots represent the methylation value of a single CpG site and their size represents coverage, while the lines represent an estimate of the individual methylation value for a sample. d Plot of hypermethylation of the HOXA cluster in DNMT3L-overexpressing cells
