
Figure 4.
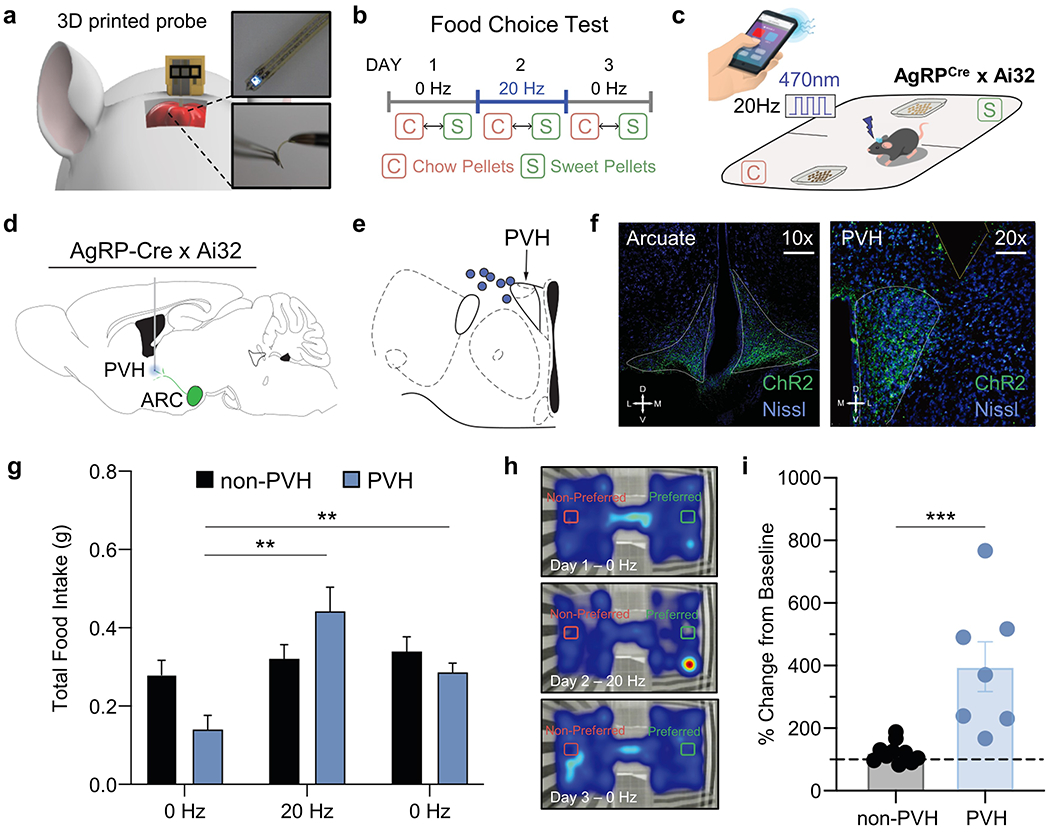
In vivo behavioral experimentation using 3D-POPs. a) Cartoon diagram depicting intracranial placement of probe, inset: photographs of probe. b) Diary of food choice test depicting timeline for optogenetic stimulation. c) Cartoon schematic of food choice test and stimulation control. d) Representative atlas cartoon depicting placement of 3D-POPs into the paraventricular nucleus of the hypothalamus (PVH) of channelrhodopsin-expressing AgRP-Cre x Ai32 (ChR2-eYFP) mice. e) Atlas cartoon showing correct targeting of the PVH (blue circles indicate confirmed correct placement of 3D-POP. f) Representative coronal immunohistological images of the arcuate nucleus (left panel) and PVH (right panel) depicting expressing ChR2 in agrpCre. Images show ChR2 (green) and Nissl (blue). Scale bars indicate 200 μm and 100 μm, respectively. g) Graph depicting total food consumed over 1 hour during 0 Hz and 20 Hz stimulation in PVH mice compared to non-PVH mice (Mixed-effects model analysis, Group x Stimulation, F(2, 30) = 17.11, p < 0.001. Tukey’s multiple comparisons revealed 20 Hz stimulation increases food consumption in PVH mice compared to 0 Hz stimulations, ** p < 0.01). h) Representative heatmaps depicting cumulative time spent with Preferred and Non-Preferred diets for PVH stimulation on Days 1-3. i) Graph depicting the percentage change in total food consumption during 20 Hz stimulation from baseline consumption (0 Hz) for non-PVH and PVH implanted mice (Student’s t-test, t = 4.116, n = 17, *** indicates p < 0.001).