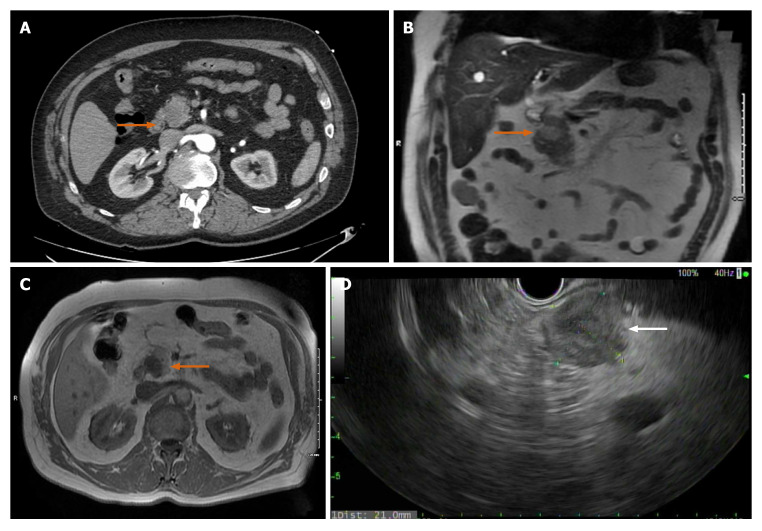
Figure 3.
Abdominal computed tomography angiography. A: Computed tomography angiography showing 2.3 cm hypodense lesion in head of pancreas; B: Magnetic resonance imaging (MRI) axial view, T1. Arrow: Mass appears as a hypointense lesion; C: Coronal MRI T2 tumor is hyperintense and solid; D: Endoscopic Ultrasound showing hypoechoic mass in pancreatic head.

