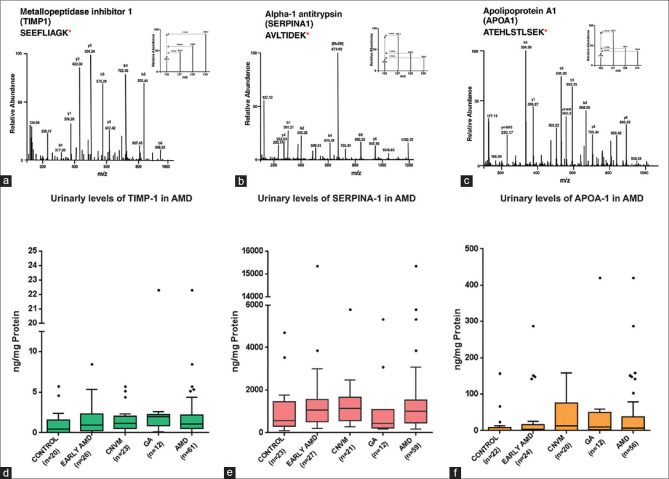
Figure 4.
Fold change of upregulated proteins in discovery phase and validation phase. Representative spectral Images of MS/MS spectra after HCD for peptide SEEFLIAGK TIMP-1 (a), peptide AVLTIDEK of SERPINA-1 (b) and peptide ATEHLSTLSEK OF APOA-1 (c).m/z 126.1 represents mass tag intensities from control samples and 127.1, 128.1 and 129.1 represents intensities from Early AMD, CNVM and GA respectively. Box and whisker plots of urinary protein levels TIMP-1 (d), SERPINA-1 (e), and APOA-1 (f) in control and AMD patients. The dots beyond the whiskers represent outliers

