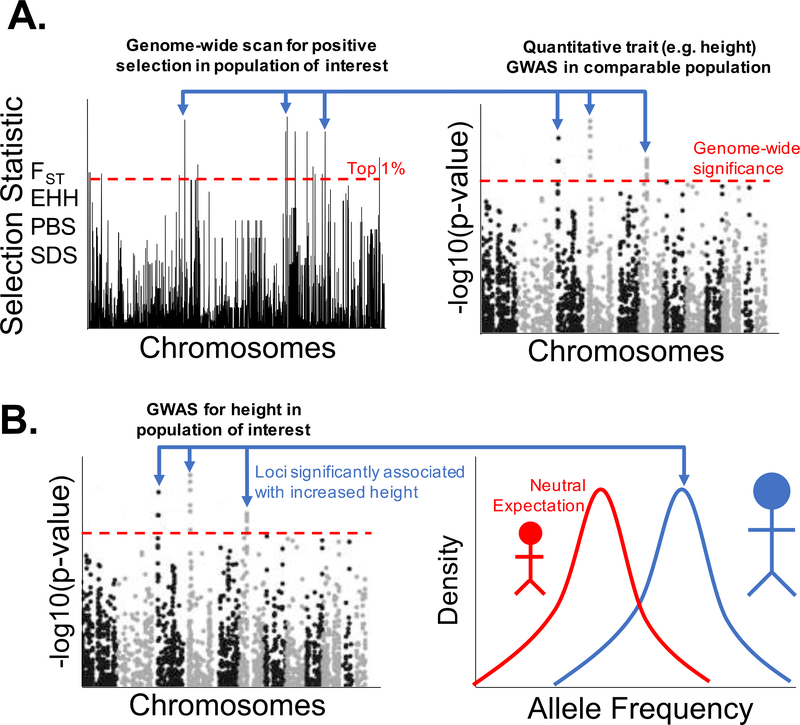
Fig. 1.
Two complementary approaches for studying the evolution of quantitative traits. (A) Left panel: Genome-wide scan for positive selection reveals candidate loci showing extreme values for some selection statistic (‘FST’ - Fixation Index; ‘EHH’ - Extended Haplotype Homozygosity; ‘PBS’ - Population Branch Statistic; ‘SDS’ - Singleton Density Score). Right panel: Loci showing strong signals of positive selection are also significantly associated with a quantitative trait (height) in a GWAS in a comparable population. (B) Loci significantly associated with a quantitative trait in a GWAS (left) show a correlated frequency change in the same direction (right), indicating polygenic selection acting on increased height.

