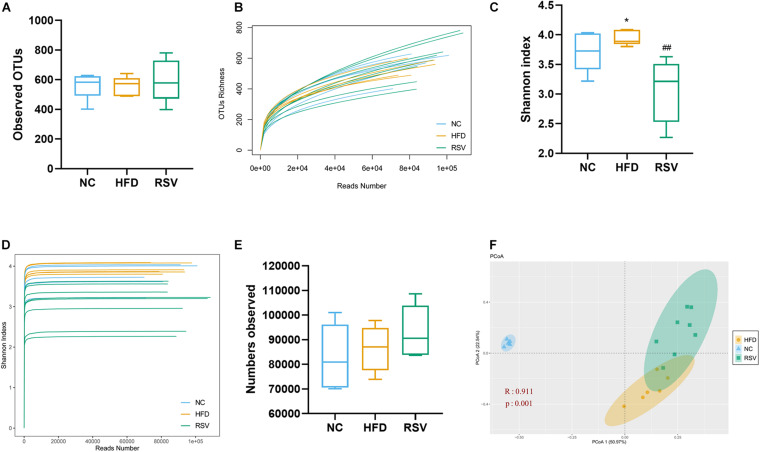
FIGURE 2.
RSV modulated the diversity of the gut microbiota in NAFLD mice. Representative alpha diversity analysis factors: (A) OTUs richness. (B) Rarefaction curves at the OTU level, (C) Shannon index. (D) Shannon rarefaction curves. (E) Observed microbiota sequence numbers. Representative β-diversity analysis factor: (F) Principle coordinate analysis (PCoA) of the fecal microbiota at the OTU level. Data are shown as the mean ± SEM, variables were analyzed using Tukey’s test, Similarities were analyzed by ANOSIM. *p < 0.05 vs NC group, ##p < 0.01 vs HFD group.

