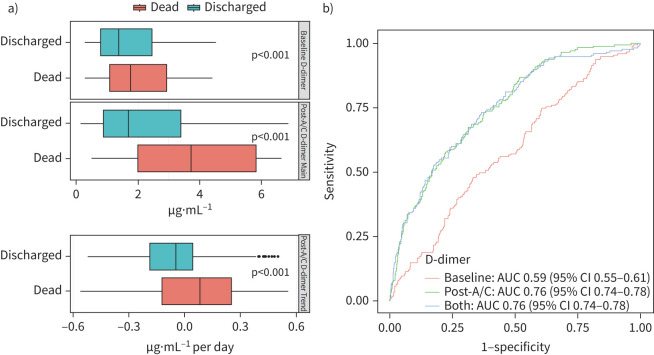
FIGURE 2.
D-dimer distribution and its association with patient outcomes. a) Boxplot of baseline and post-anticoagulation (post-A/C) D-dimer values. b) receiver operating characteristic curves of prediction models with baseline D-dimer, post-anticoagulation D-dimer and both (area under the curve (AUC) 0.59, 0.76 and 0.76, respectively).

