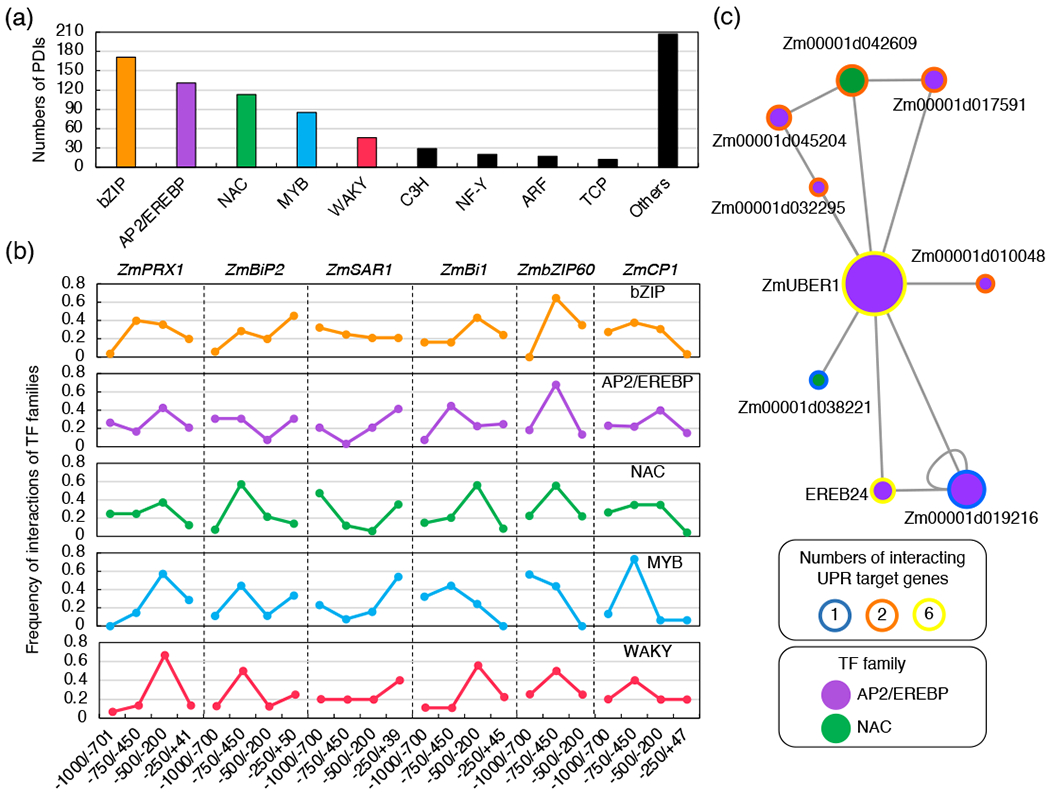
Figure 3. Interactions between TFs on promoters of UPR genes.

(a) Numbers of PDIs associated with TF families. The full list of PDIs with the TF family membership is available in Table S2. (b) Frequency distribution for the binding of multiple TF family members to each of promoter fragments used in the eY1H screens. TF families of which the number of PDIs was greater than 45 are shown. (c) TF interaction networks of ERF and NAC TFs that bound to promoters of the UPR genes. The size of the nodes is proportional to the number of interactions. The color of nodes indicates the number of interactions of each TF with UPR target genes.
