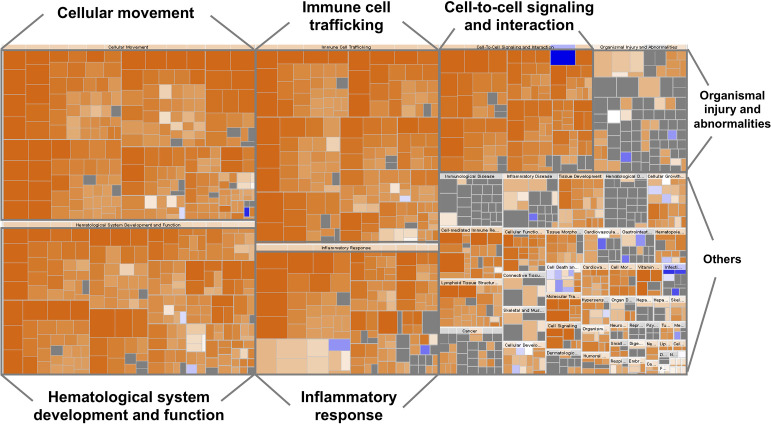
Figure 1.
Heatmap representing the classification of diseases and functions by ingenuity pathway analysis (IPA). The visualization is a hierarchical heat map of functional categories generated by IPA software in which the major boxes represent a family (or category) of related functions. Within each box, each individual rectangle is a sub-function linked to the biological function of a group of proteins. The size of a rectangle is correlated with increasing overlap significance among the proteins members of the related function and the query proteins. The color scheme shown is based on z-scores, with activation in orange, inhibition in blue and undetermined functions in gray. Darker shades indicate higher absolute z-score heat map. For instance, most ‘Inflammatory response’, ‘Cellular movement’, ‘Immune cell trafficking’, ‘Cell-to-cell signaling and interaction’, ‘Hematological system development and function’ proteins were over-represented.

