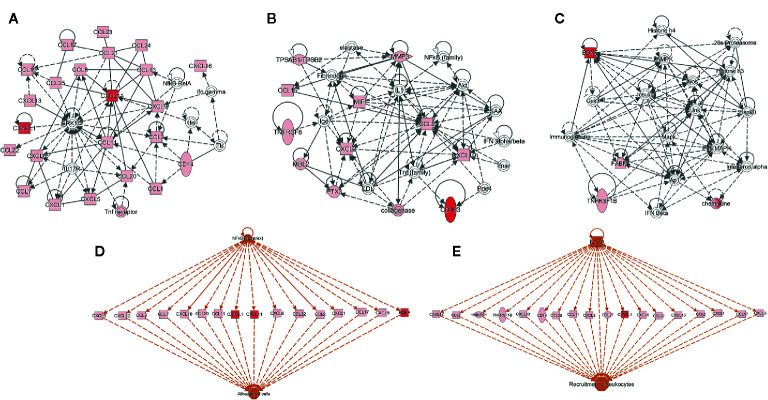
Figure 2.
Functional and upstream regulatory networks. The most significant networks included proteins related to: (A) Cell-to-cell signaling and interaction, and cellular movement, (B) immune cell trafficking and inflammatory response, (C) organismal functions, hematological disease, and metabolic disease, (D, E) top-scoring network of regulator effects activated in the list of 63 biomarkers. Protein interaction networks were constructed using the ingenuity pathway analysis (IPA) software. Nodes shaded in pink represent proteins present in the list of 63 biomarkers; red nodes are proteins that are CXCL11 (I-TAC), CX3CL1 (Fractalkine), Brain Derived Neurotrophic Factor (BDNF), and sCD163; and proteins that are not found in the list of 63 biomarkers are in white. Dotted lines indicate indirect molecular interactions between proteins and continuous lines between nodes indicate direct functional interactions between connected proteins. Orange lines lead to activation.

