Figure 4.

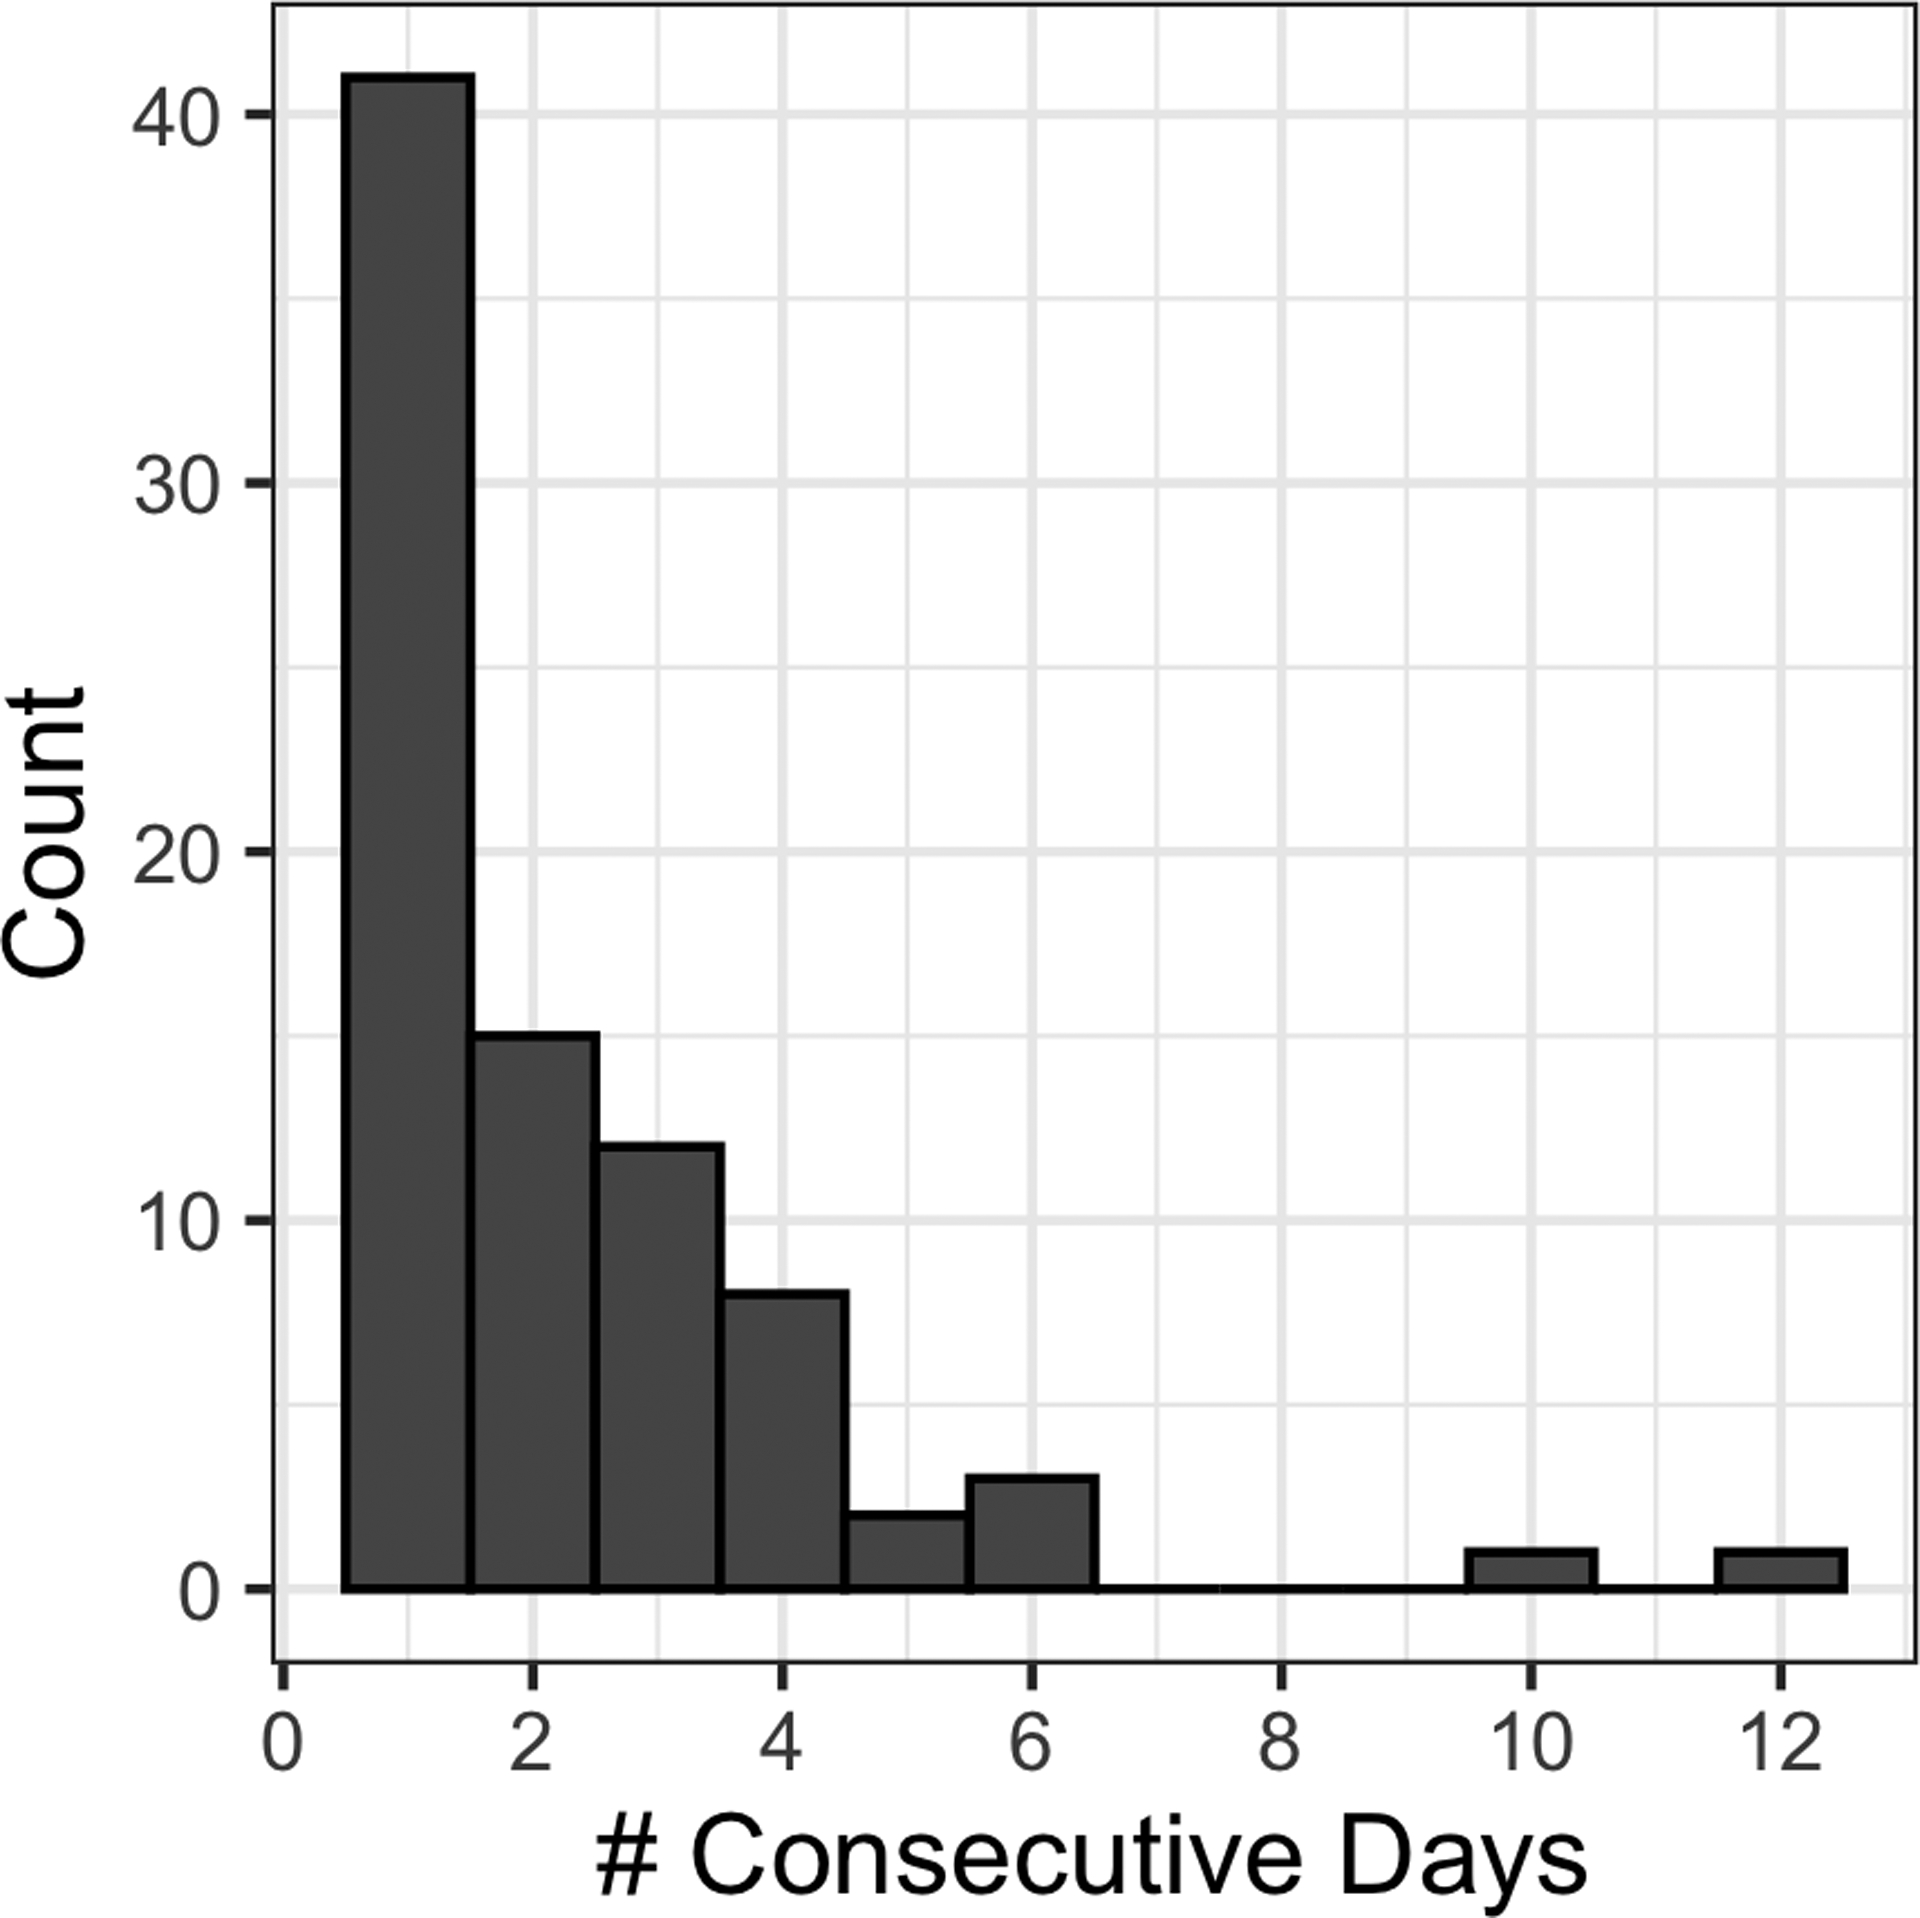
Histogram showing the distribution in the length of events (# consecutive days) in which riverine discharge and seiche intensity were < 50th percentile while easterly winds were > 50th percentile during June–September from 2008 to 2017.

Histogram showing the distribution in the length of events (# consecutive days) in which riverine discharge and seiche intensity were < 50th percentile while easterly winds were > 50th percentile during June–September from 2008 to 2017.