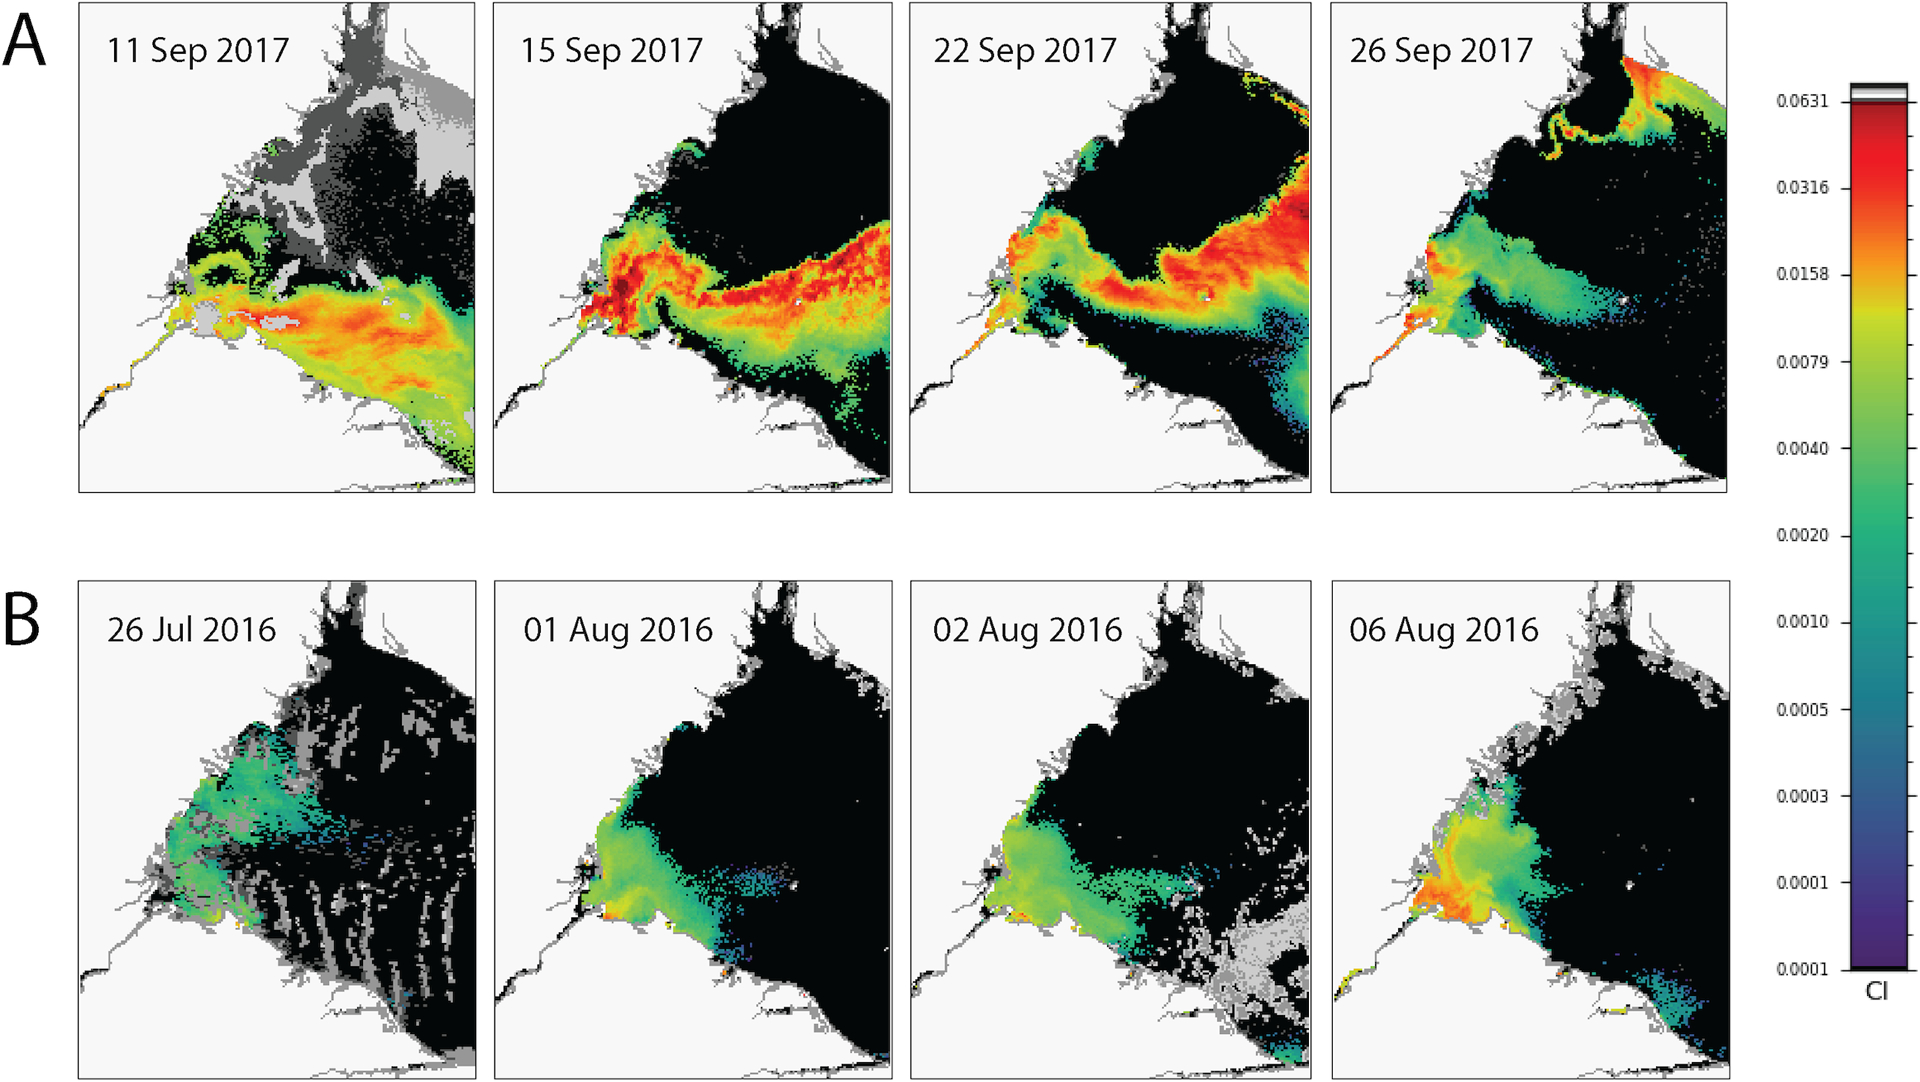
Figure 5.

Time series of daily satellite images showing the changing spatial structure of cyanobacterial blooms visualized by the cyanobacterial index (CI) in the lower Maumee River and the western basin of Lake Erie during extended high-retention periods in (A) 2017 and (B) 2016. Color scale is on the right with CI values on the left side of the bar.
