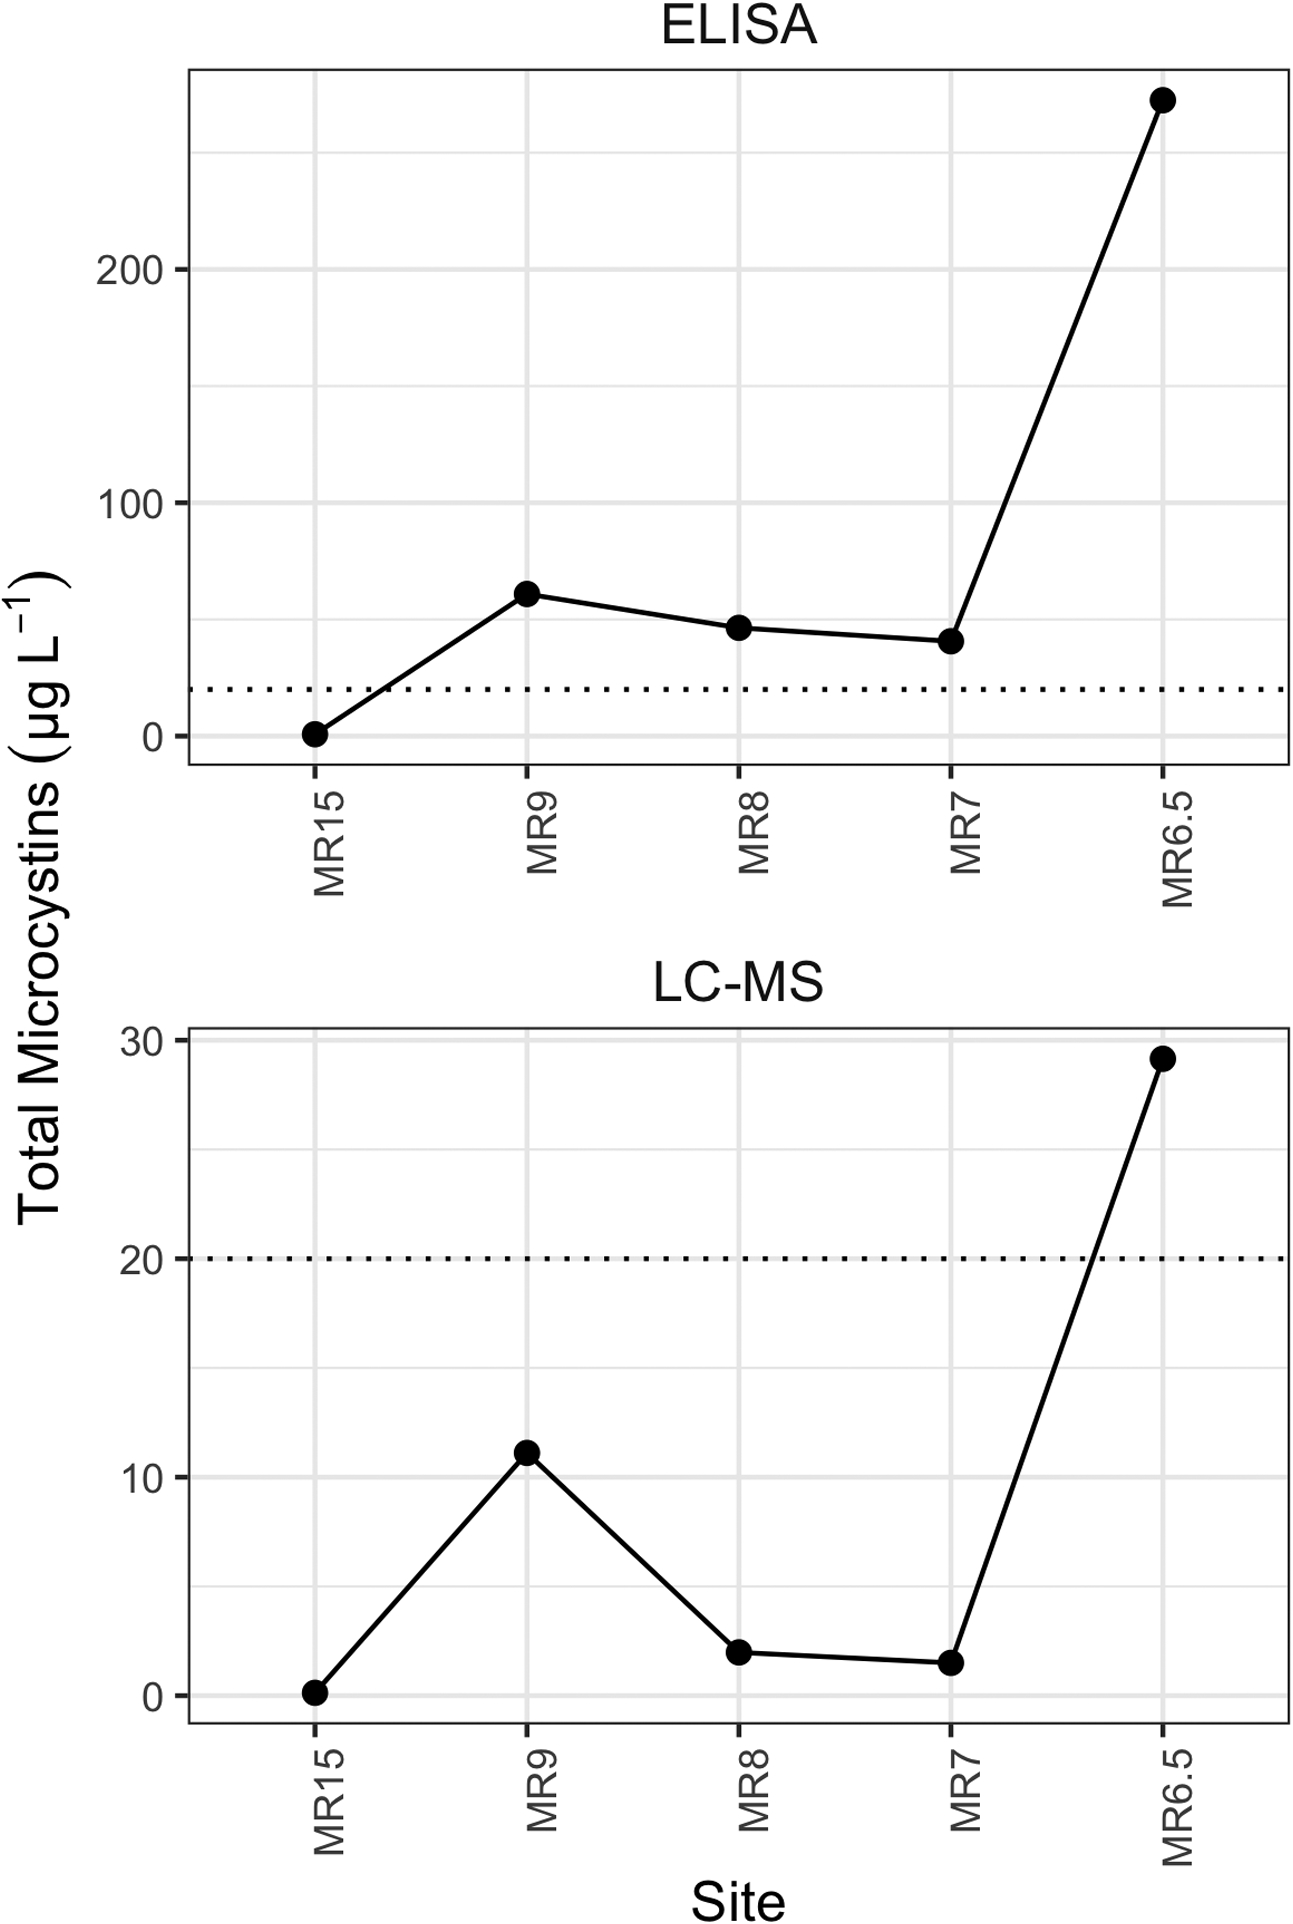
Figure 6.

Levels of total microcystins measured at estuary sites along the Maumee River on 25 September 2017 using ELISA (top row) and LC-MS (bottom row). Horizonal dashed line represents the State of Ohio Elevated Recreational Public Health Advisory threshold (20 μg L−1). Sites are listed in order from furthest up river within the estuary (MR15) towards the river mouth (MR6.5).
