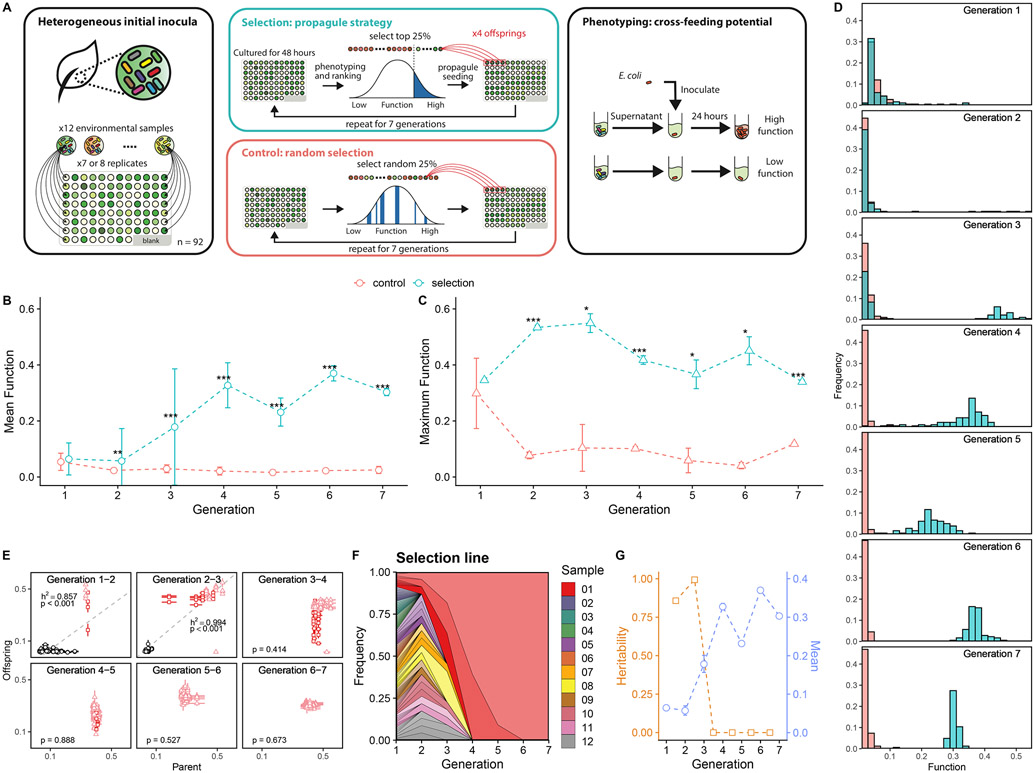
Fig. 2. Artificial selection of cross-feeder communities.
A. Experimental scheme: the artificial selection on the cross-feeding potentials of communities on a target organism E. coli. Cross-feeder communities were obtained from 12 leaf and soil samples and grown on citrate-M9 medium. Community function (f) is determined by f=Yc/Yg, where Yc is the yield of E. coli grown on community filtrate as the only carbon source and Yg is the E. coli yield growing on a glucose-M9 medium. B. Mean community function over generations. Green circles represent the mean functions of 92 cross-feeder communities (± 1 SD) in the selection line. Red circles represent the random control line. Asterisks indicate generations in which the community functions differ significantly between selection and control lines (Welch’s two-sample t test. *** indicates p < 0.001, ** indicates p<0.01, * indicates p<0.05; from generation one to seven: N=184, 184, 180, 184, 180, 176, 164, respectively. Sample sizes vary because of removal of cross-contaminated wells. Methods). As shown in Fig. S2, the unnormalized function Yc exhibits the same qualitative response to selection we find for the normalized case. C. Maximal community function. Green triangles represent the mean of the triplicate measurement of the best performed community (± 1 SE, N=3) in the selection line. Red triangles represent the control line. Asterisks denote the same significant levels as those shown. D. Distribution of community functions in the selection and control lines over the seven generations. Bins are semi-transparent to show the overlapped counts in each line. E. Community functions of parent-offspring pairs in the selection line. Light red triangles denote the lineage of the dominant community that eventually spread over, dark red squares denote the lineage of the second dominant community (the last community being dropped), and the black circles represent the other lineages. Error bars are the standard errors of mean in the triplicate measurements. Grey dashed line represents the mean fitted linear regression from 1000 bootstraps. P-value reported here represents the fraction of non-significant linear regression slopes in 1000 bootstraps, e.g. P<0.001 means that linear regression of every bootstrapped data gives a significant slope (see Methods). The regression slope is an estimate of the trait heritability at the community-level (Blouin et al. 2015; C. J. Goodnight 2000). F. Muller plot showing the fraction of the metacommunity in the selection line that is made up by the “descendants”of the different starting communities. The plot shows the rapid “fixation” of the dominant, highest function community. Each color represents one of the 12 soil and leaf samples from which the cross-feeder communities were initially inoculated. G. Heritability (h2) and mean function (± 1 SE) of the selection line at different rounds of selection (generations). The mean function is the as shown in A. The heritability drop after the fourth selection round coincides, as expected, with the lack of further response of the mean to selection.

