
Figure 2.
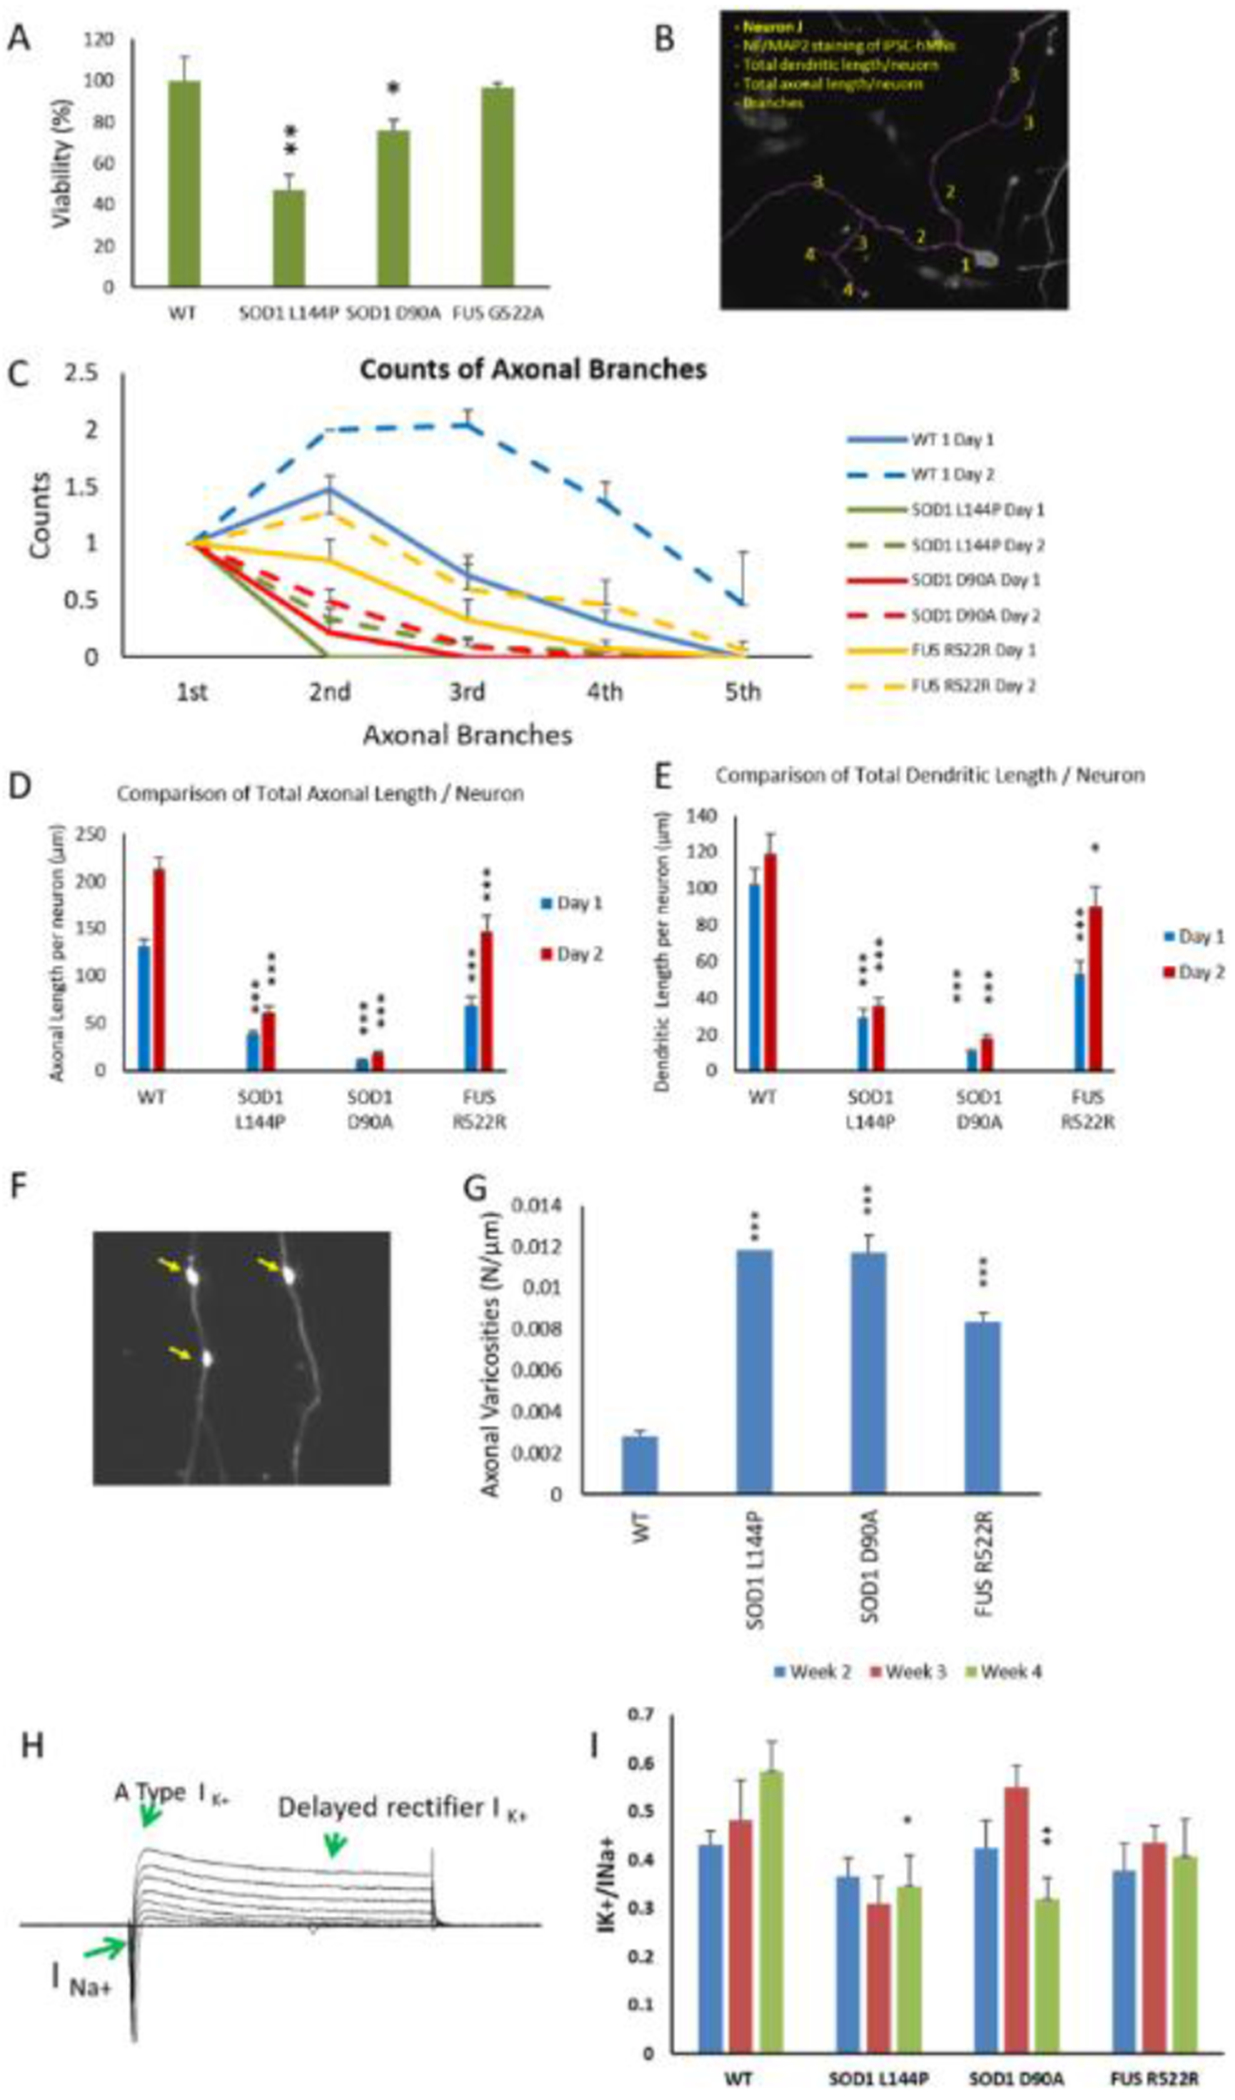
Phenotypic analysis of ALS-MNs. MNs from 3 ALS-iPSC lines were analyzed and compared to WT. A) Viability of MNs derived from different iPSC lines. Cultures from the same batch of platings were fixed at D1 and D7 separately and immunostained with neuronal markers Neurofilament and MAP2. The number of MNs were imaged at 20X from the same area size of the coverslips, quantified and normalized to Day 1 within the same plating batch to eliminate any batch-related variation. All data from the mutant lines were then normalized to WT to eliminate cell death caused by any experimental procedure as a determinant variable. At least two coverslips were analyzed for each time point in each batch and all the data were normalized to the average of 3 coverslips from day 1 within the batch. For each genetic group, at least 2 batches of analysis were quantified. B-E) Morphological analysis of ALS-MNs. IPSC MNs from DIV1 and DIV2 were immunostained for neurofilament (NF) and MAP2 to visualize the axonal and dendritic morphology, respectively. The images were analyzed in Neuron J for quantification of branching and measurement of process length (an illustration of the morphological analysis procedure is displayed in (B)). ALS mutant MNs demonstrated reduced counts of axonal branches per neuron (C), total axonal length per neuron (D) and total dendritic length per neuron (E) on Day 1 and Day 2 of the cultures. All the comparisons were between mutant and WT on the same day for each ALS line. F-G) Quantification of axonal varicosities in each ALS-MN line. MNs on D17 were immunostained with SMI32 and axonal varicosities per neuron were counted in image J and normalized to axonal length (μm) (F). A significant increase of axonal varicosities was observed in all ALS-MN groups (G). H-I) Patch clamp analysis of ALS-MNs. (H) is a sample set of current recordings under voltage clamp. (I) Quantifications of the Na+ and K+ currents revealed a significant reduction of the K+(DR) /Na+ current ratio on week 4 in all three ALS-MN lines compared to the WT-MN line, suggesting a hyper-excitability phenotype. Data represent mean ± SEM. Asterisks indicate that the condition is significantly different than the WT at the same time point (Dunnett’s test): * p<0.1, ** p<0.01, *** P<0.001. For B-G, n≥ 30 neurons from at least 3 batches of culture were analyzed. For H-I, n≥5~17 neurons from at least 2 batches were analyzed.