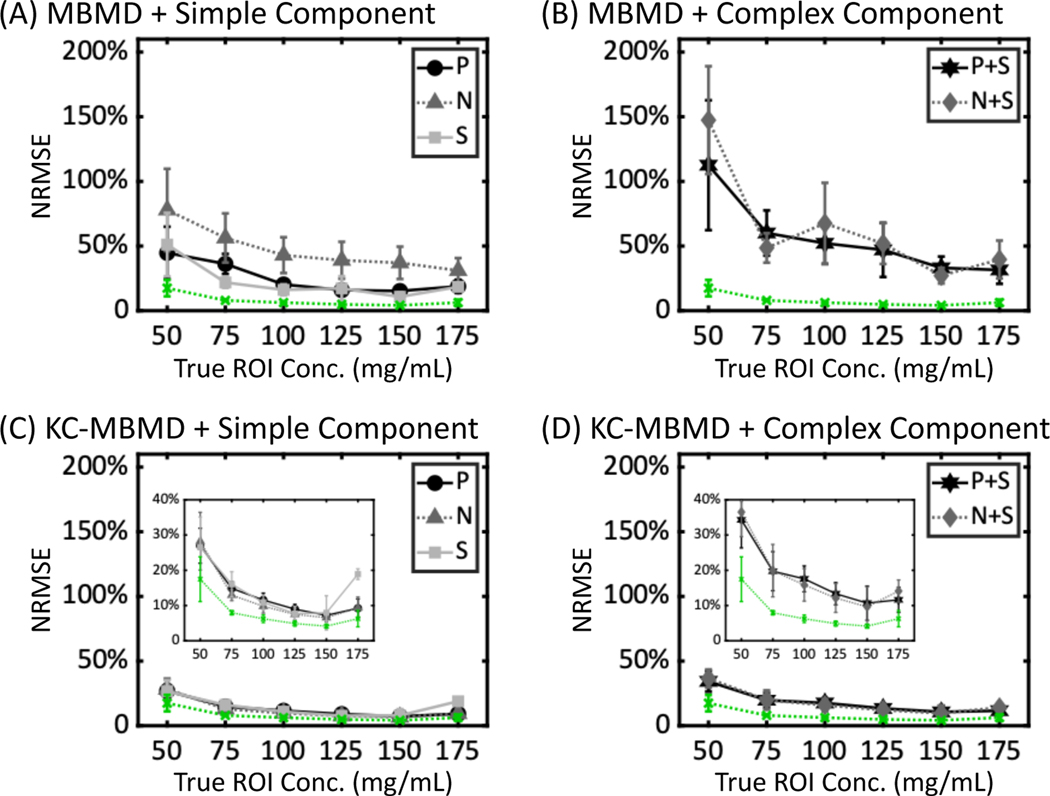
Figure 7.
NRMSEs of Ca concentrations for (A) MBMD in scenarios involving simple implant assemblies (P, N and S), (B) MBMD and complex implant assemblies (P+S and N+S), (C) KC-MBMD and simple implant assemblies, and (D) KC-MBMD and complex implant assemblies. Markers and error bars denote means and standard deviations of slice NRMSEs for each Water-Ca sector. Green dotted lines represent MBMD of a phantom without metal. The plots in the insets use a magnified vertical axis to emphasize the differences in KC-MBMD performance across the metal configurations.

