
Fig. 6. Injectable ITA polymer reduces biomaterial host response in a peritoneal infiltration model.
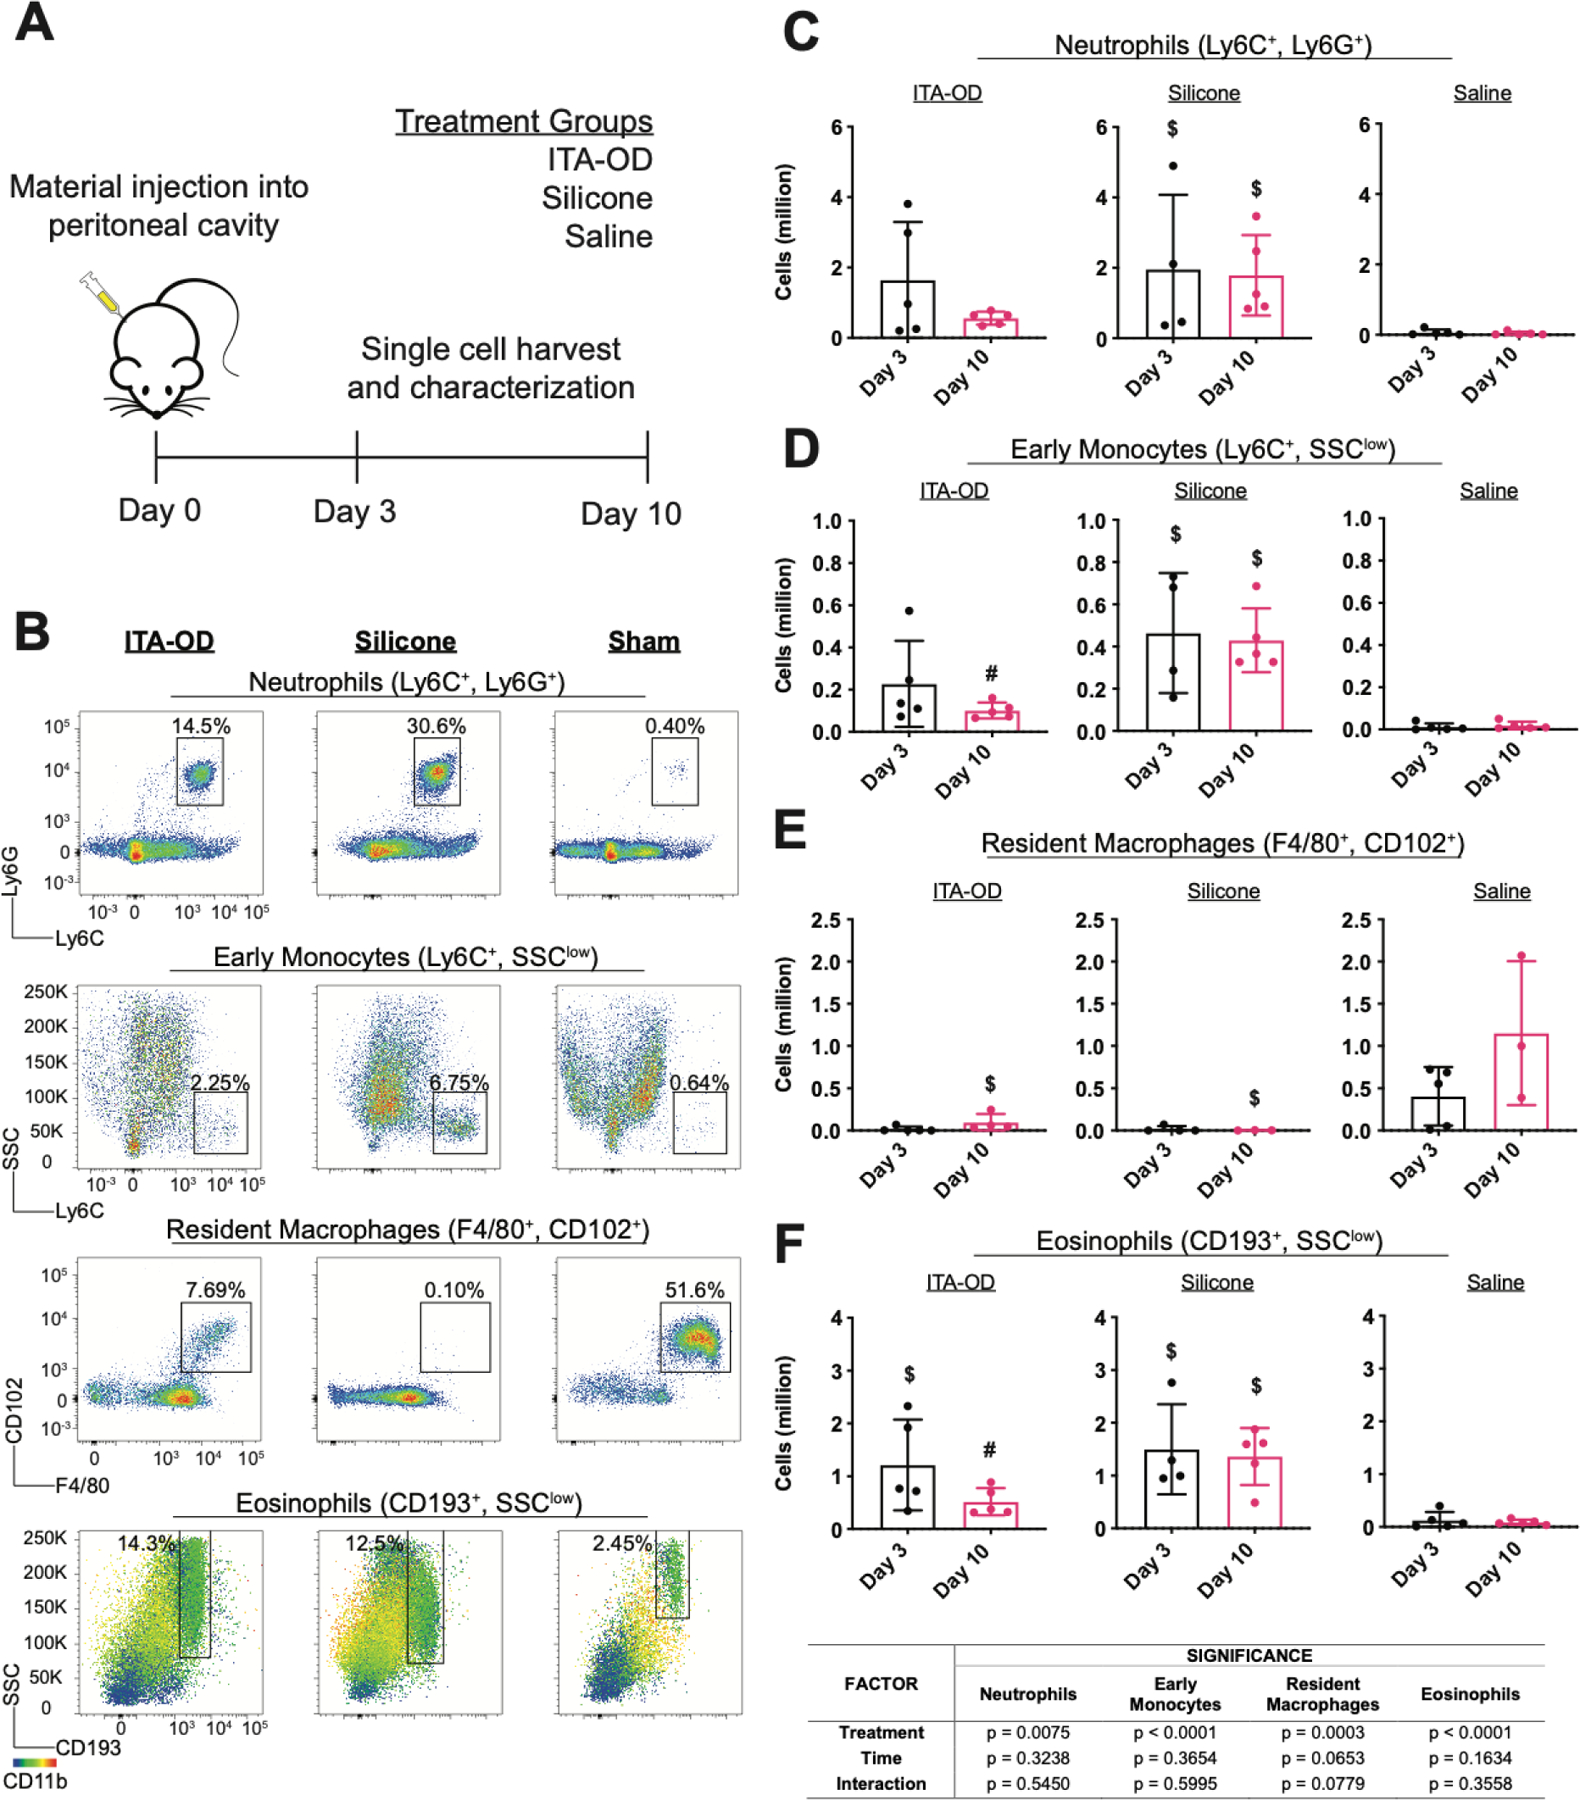
(A) Experimental schematic for peritoneal biomaterial associated immune cell infiltration model. (B-F) Using flow cytometry assessment, we quantified immune cell infiltration into the peritoneum following injection of ITA-OD (50μL), hydroxy terminated polydimethylsiloxane (Silicone) (50μL), or saline (Sham), with a comparable untreated group (Blank). (B) Representative flow cytometry plots for ITA-OD (left), silicone (center), and saline sham (right) ten days post injection. Percentage of total live cell populations is indicated for each identified cell population. Quantified cell populations (C-F) three and ten days post injection demonstrate the resolution of inflammatory infiltrate in ITA-OD treated animals. At each timepoint, we quantified (C) neutrophil, (D) early monocyte, (E) resident macrophage and (F) eosinophil populations. Cell population was determined through quantified total live cells and corresponding gated cell populations. Data are mean ± SD, n≥3. Two way ANOVA followed by pairwise comparison with Tukey’s multiple comparisons test. Statistical significance between material groups at each time point (p<0.05) is indicated as #: difference between polymer groups, $: difference from saline group.