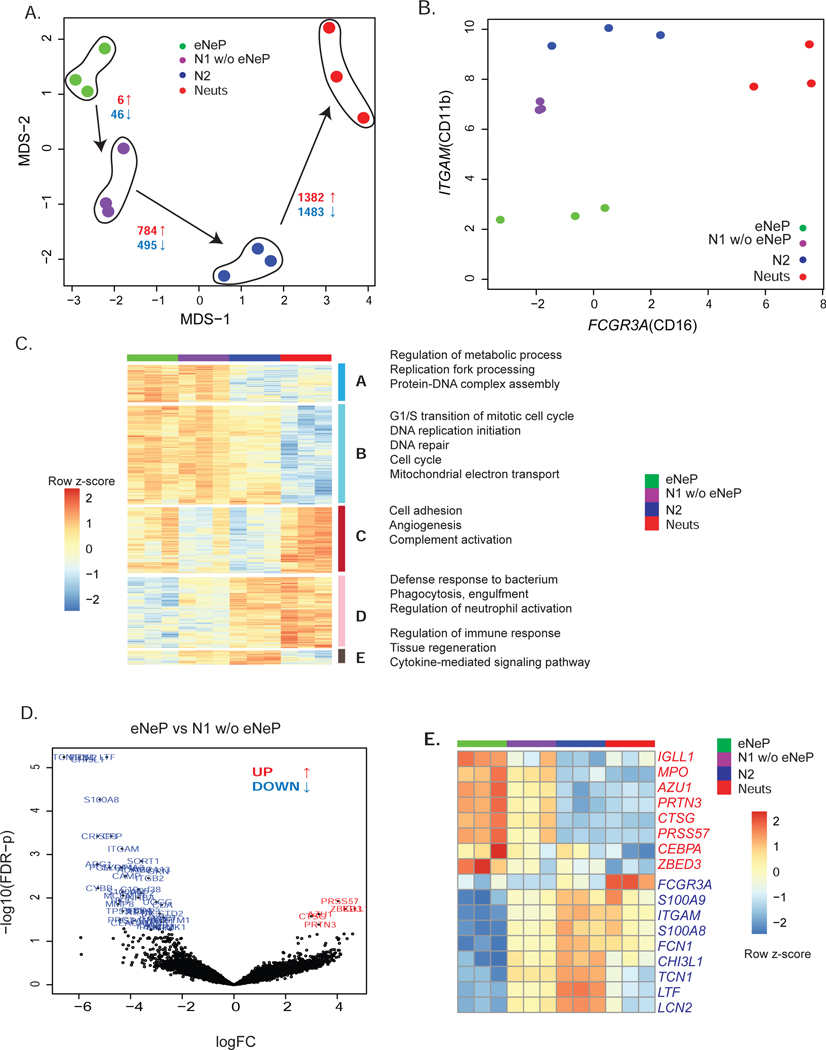
Figure 6. Transcriptome analysis reveals distinct gene expression of eNeP.
A) eNep, N1 w/o eNeP, N2 and N3-4-5 (Neuts) were fluorescence-activated cell sorted, followed by bulk RNA sequencing. Please also see Fig. S6. MDS plot of eNeP, preNeu-like, immature and mature neutrophils (3 replicates each) suggested the developmental stages starting with eNeP toward more mature neutrophils. Number of statistically significant differentially expressed (logFC 2 and FDR-corrected p-values cutoff 0.05) genes (red: up-regulated, blue: down-regulated) for the comparison between eNep-N1(w/o eNeP), N1(w/o eNeP) - N2, N2 - mature neutrophils (N3-4-5).
B) Log2 expression of CD11b (ITGAM) and CD16 (FCGR3A) of the 4 sorted neutrophil subsets shown in A aligned with the conventional neutrophil development gating strategy (Hidalgo et al. 2019) of neutrophil maturation from promyelocytes to mature neutrophils (compare to Fig. 3D).
C) Five gene clusters from pairwise differentially expression analysis between two neutrophil subsets next to each other in the developmental lineages (eNeP-N1(w/o eNeP), N1(w/o eNeP) - N2, N2 - mature neutrophils (N3-4-5)). Biological process GO terms that were enriched in each of 5 subsets.
D) Volcano plot of differentially expressed genes between the earliest neutrophil progenitor subsets eNeP and N1 w/o eNeP (−log 10 adjusted p-values - yaxis and log2FC - xaxis) revealed 6 up-regulated genes in eNeP.
E) Top up- and down-regulated genes (logFC 2, FDR-corrected p values 0.05) in eNeP from (D) and neutrophil genes (transcriptional factors CEBPA/E, neutrophil marker MPO, AZU1, FCGR3A, S100A8/9) confirmed early developmental stage of eNeP.

