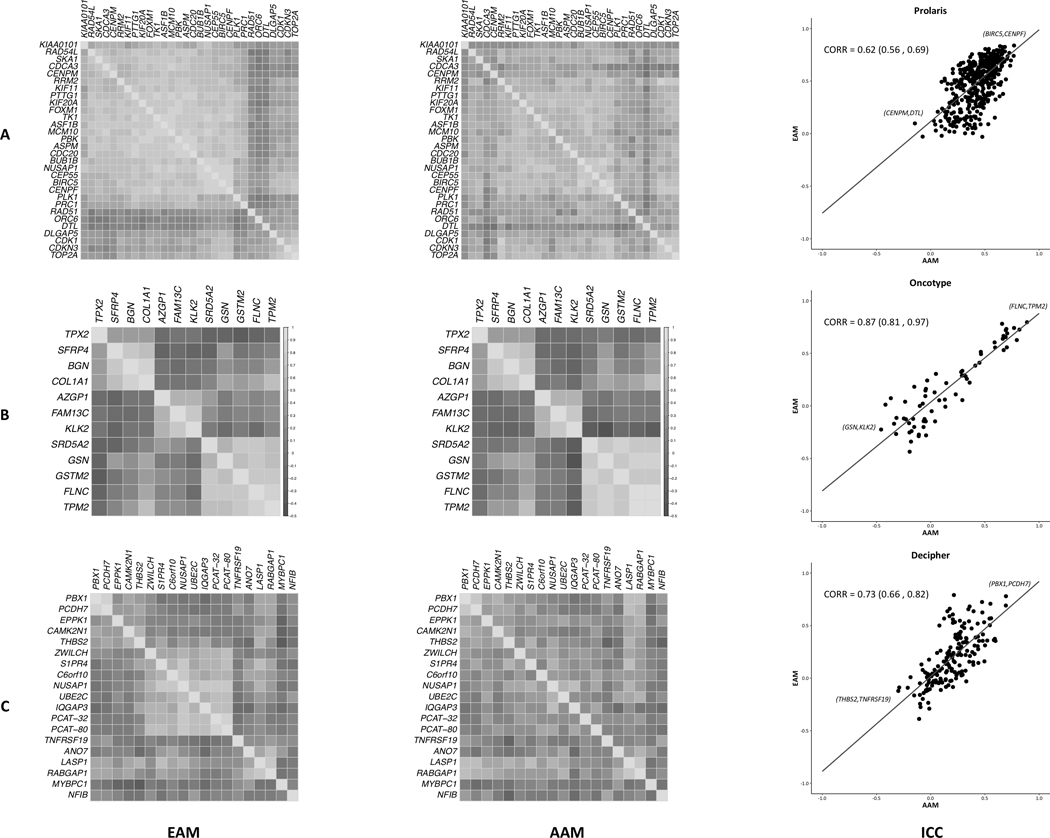
Figure 2:
The panels are Prolaris (A), Oncotype Dx (B) and Decipher (C). Heatmap of inter-gene Spearman’s correlations, EAM (left) and AAM (right), are shown in the first two columns. CAPRA-S weighted integrative correlation coefficients (ICC) and 95% confidence intervals for genes in each panel are shown in the far-right column. Gene pairs with the highest and lowest correlation in each panel are annotated.

