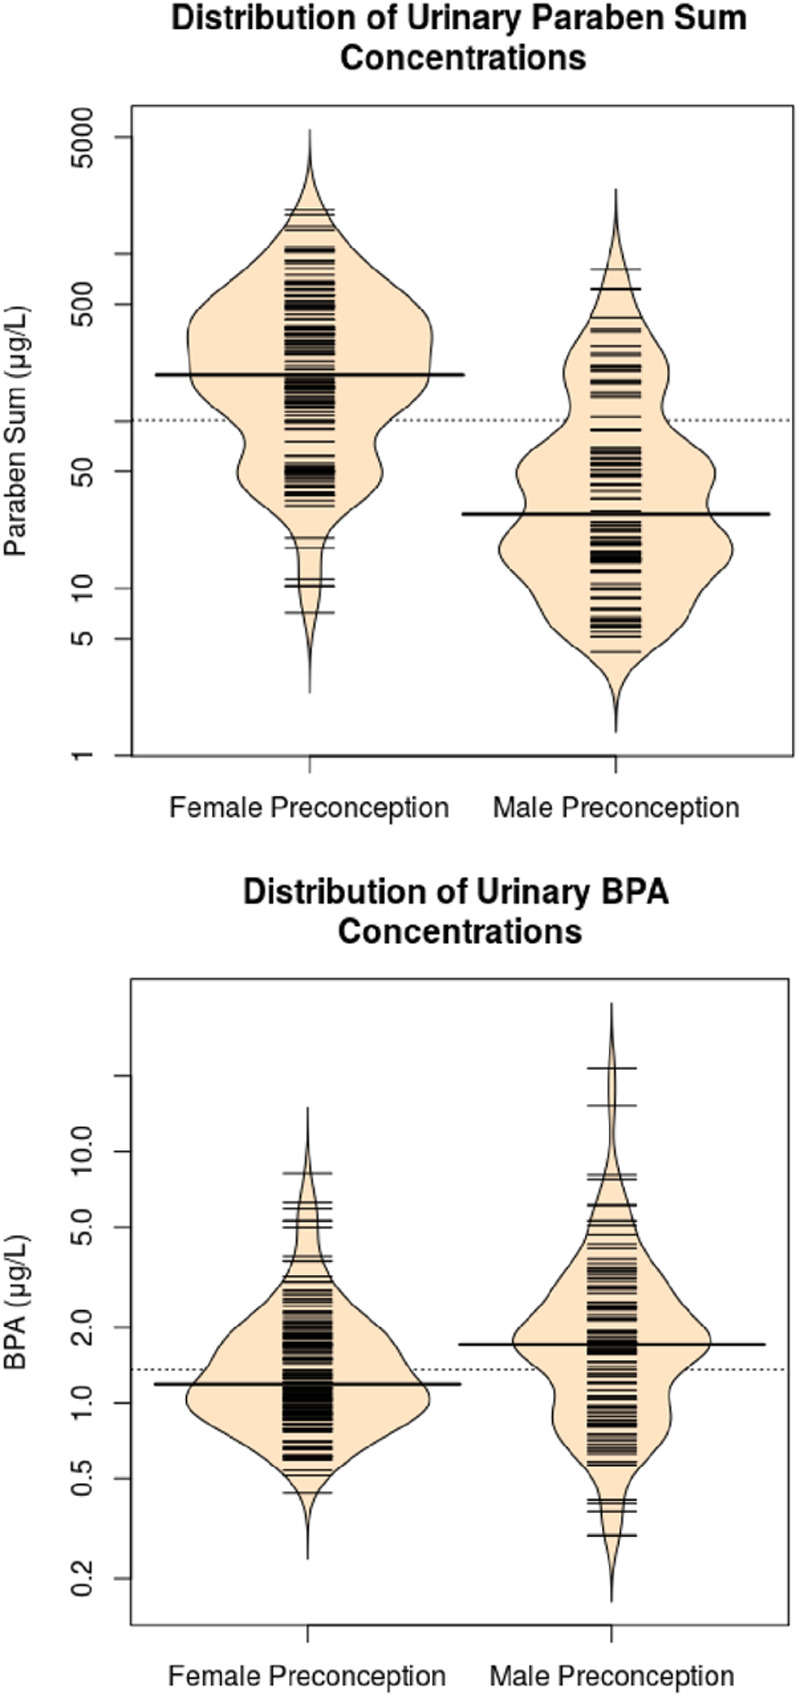
Figure 1.

Violin plots of specific gravity-standardized maternal and paternal preconception urinary bisphenol A and ∑paraben concentrationsa,b. aViolin plots show the kernel probability density of the data. Each small line represents a participant and the longer lines are the median urinary concentration. bFor females butyl, methyl, and propyl constitute the ∑paraben. For males, methyl and propyl constitute the ∑paraben.
