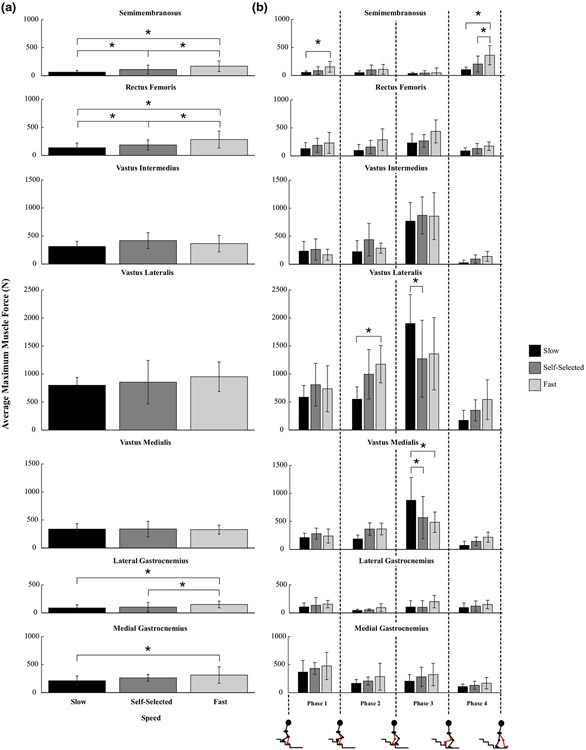
FIGURE 2.
Average maximum muscle forces for muscles that span the knee joint across (a) speeds and (b) speeds (slow, self-selected, and fast) within each phase. Error bars span ± one standard deviation. An asterisk (*) indicates that the force generated by the muscle was significantly different between the respective speeds (a) or the respective speeds within the phase (b, p < 0.05).

