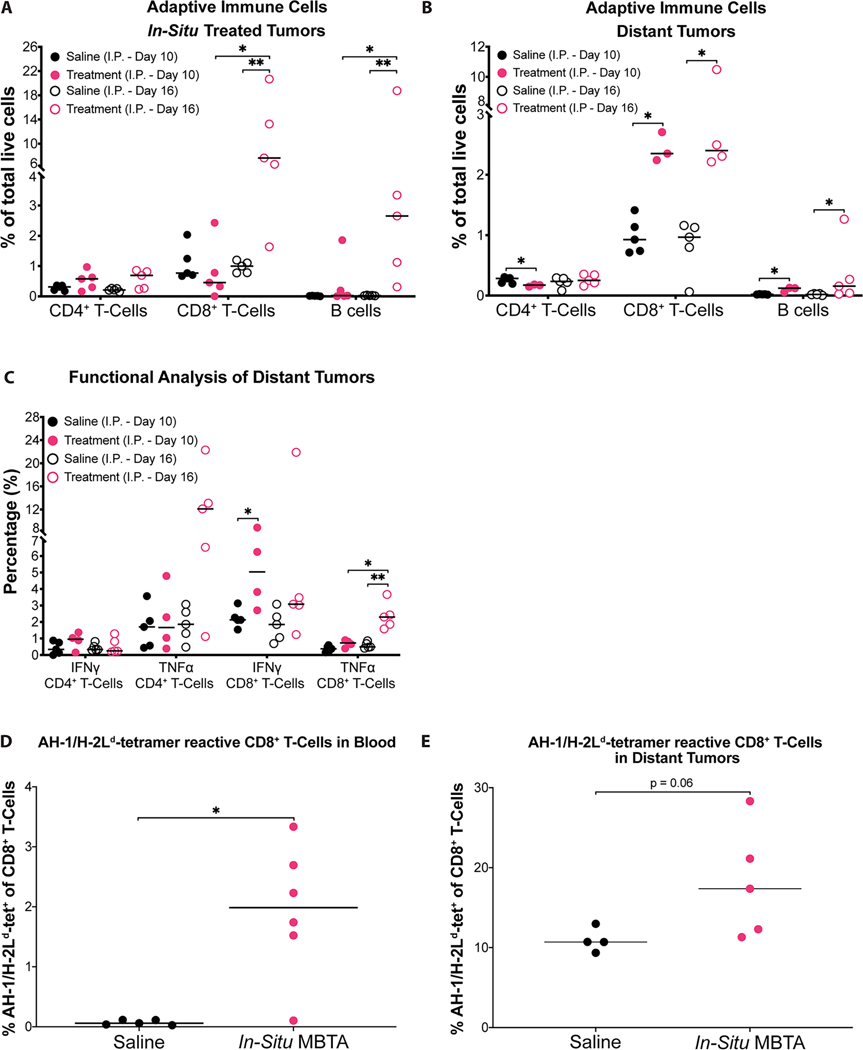
Figure 4: Enhanced adaptive immunity against CT26 tumors after MBTA treatment.
A & B) Percentage of adaptive immune cells in total live tumor dissociated cells. Adaptive immune cells found within right and left flank tumors corresponding to I.P. Day 10 and 16 analyses are shown; C) Percentage of IFNγ or TNFα positive CD4+ or CD8+ T-cells per total CD4+ or CD8+ T-cells, respectively. Harvested left flank CD4+ and CD8+ T-cells corresponding to Day 10 and 16 analyses were stimulated for 5 h with PMA/Ionomycin ex-vivo and intracellular IFNγ and TNFα was determined by flow cytometry; D & E) Percentage of AH-1-specific CD8+ T-cells extracted from whole blood and left flank tumors, respectively. Saline-treated control mice (black); in-situ MBTA treated mice (pink); Data is shown as individual plots with median. *p < 0.05, ** p < 0.01 by Mann-Whitney U test. Example gating strategy for each cell population is demonstrated in Figure. S11–13 (Supporting Information). A total of 20 mice were used to complete immunophenotyping (I.P.) experiments. These were allocated to the following treatment groups: Saline I.P. Day 10 (n=5); MBTA Treatment I.P. Day 10 (n=5); Saline I.P. Day 16 (n=5); MBTA Treatment I.P. Day 16 (n=5); For blood tetramer experiments, 5 mice were in the saline treatment arm and 6 mice were in the MBTA treatment arm. For tumor tetramer experiments, 4 mice were in the saline treatment arm and 5 mice were in the MBTA treatment arm.

