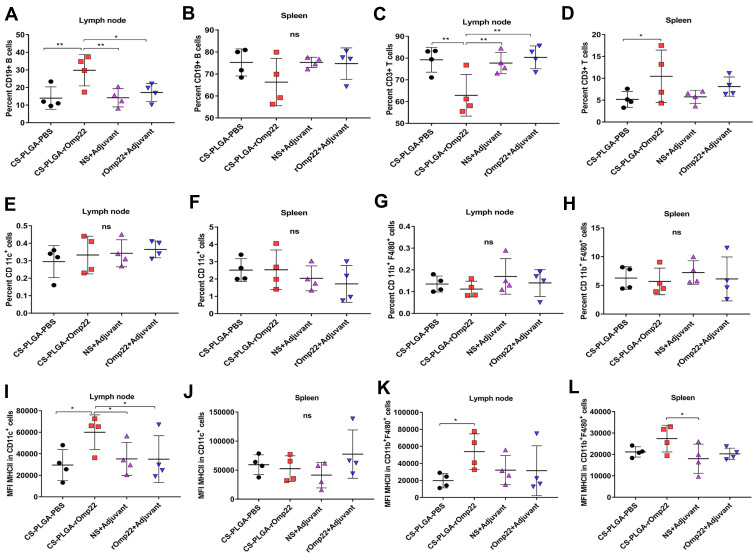
Figure 7.
Flow cytometry analysis of the draining lymph nodes and splenocytes.
Notes: (A–D)The scatterplot presents the percentage of CD19+B cells and CD3+T cells in the lymph node and spleen 7 days after the last immunization. (E–H) The scatterplot presents the percentage of CD11c+ dendritic cells or CD11b+F4/80+ cells in the lymph node and spleen. (I–L) Scatterplots present the major histocompatibility complex class II (MHC II) expression on CD11c+ dendritic cells or CD11b+F4/80+ cells in the lymph node and spleen. Statistics were performed using one-way ANOVA with Tukey’s post hoc correction (n=4). In all studies, *P < 0.05, **P < 0.01 .
Abbreviation: MFI, mean fluorescence intensity.

