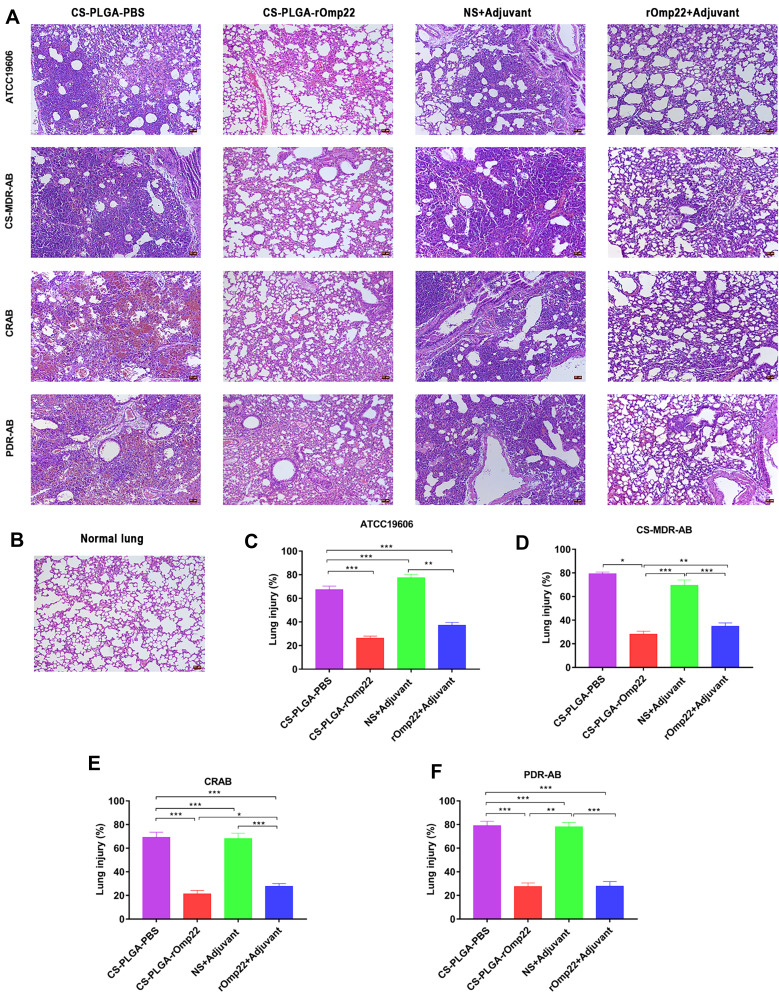
Figure 9.
Lung histopathology.
Notes: Lung specimens were taken from six mice challenged with A. baumannii in each group at 24 h post-challenge. Lung tissue sections were stained with haematoxylin-eosin and observed under a microscope (200×). (A) Lung tissue from different immunized groups subjected to A. baumannii ATCC 19606 and three clinical A. baumannii strains (scale bar, 50 μm). (B) Lung tissue from unimmunized uninfected normal BALB/c mouse showing normal histological characteristics (Scale bar, 50 μm). (C–F) Semiquantitative analysis of the inflammatory area in the lung tissue (n=6). Histograms show the mean percentage of lesion area within the total lung. Data are presented as the means± SD (n=6). *P < 0.05, **P < 0.01, ***P < 0.001.

