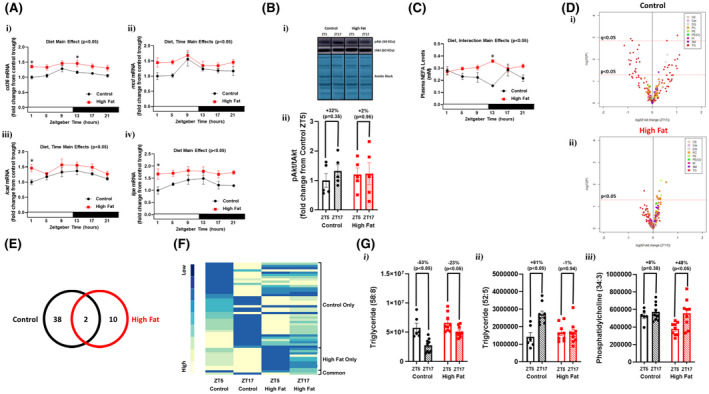
FIGURE 5.

Diminished day‐night differences in the cardiac lipidome of obese mice. Hearts and plasma were isolated from mice (at ZT1, ZT5, ZT9, ZT13, ZT17, and ZT21) that were fed either a control or high fat diet in an ad libitum fashion for 20‐wk (n = 5‐9). A, Diurnal variations in cardiac cd36 (i), mcd (ii), lcad (iii), and lipe (iv) mRNA levels in control and high fat fed mice. B, Day (ZT5) versus night (ZT17) differences in the ratio of phosphorylated Akt to total Akt (ie, pAkt/tAkt) in hearts of control and high fat fed mice. C, Diurnal variations in plasma NEFA levels in control and high fat fed mice. D, Volcano plots indicating day‐night (ZT5‐ZT17) differences in the cardiac lipidome of control (i) and high fat fed (ii) mice; the x axis corresponds to fold changes (FC) of MS signal intensity values for all annotated lipids at ZT17 versus ZT5 (log2), the y axis corresponds to P‐values (‐log 10); the horizontal dotted lines indicates the cut‐off for P < .05 and Q < 0.05, as indicated; color indicates distinct lipid species classification abbreviated: CE (cholesterol ester), Cer (ceramide), DG (diglyceride), PC (phosphatidylcholine), PE (phosphatidylethanolamine), PE(O) (ether‐linked PE), PI (phosphatidylinositol), SM (sphingomyelin), and TG (triglyceride). E, Venn diagram indicating numbers of lipid species with day‐night differences in hearts of control and/or high fat fed mice (based on P < .05). F, Heat map illustrating lipid species in hearts of control and/or high fat fed mice with day‐night differences in levels (based on P < .05); sub‐grouping is based on whether day‐night differences were observed in control mice only, high fat fed mice only, or common in both groups. G, Examples of lipid species with day‐night differences in hearts of both control and high fat fed mice (i), only in control mice (ii), or only in high fat fed mice (iii)
