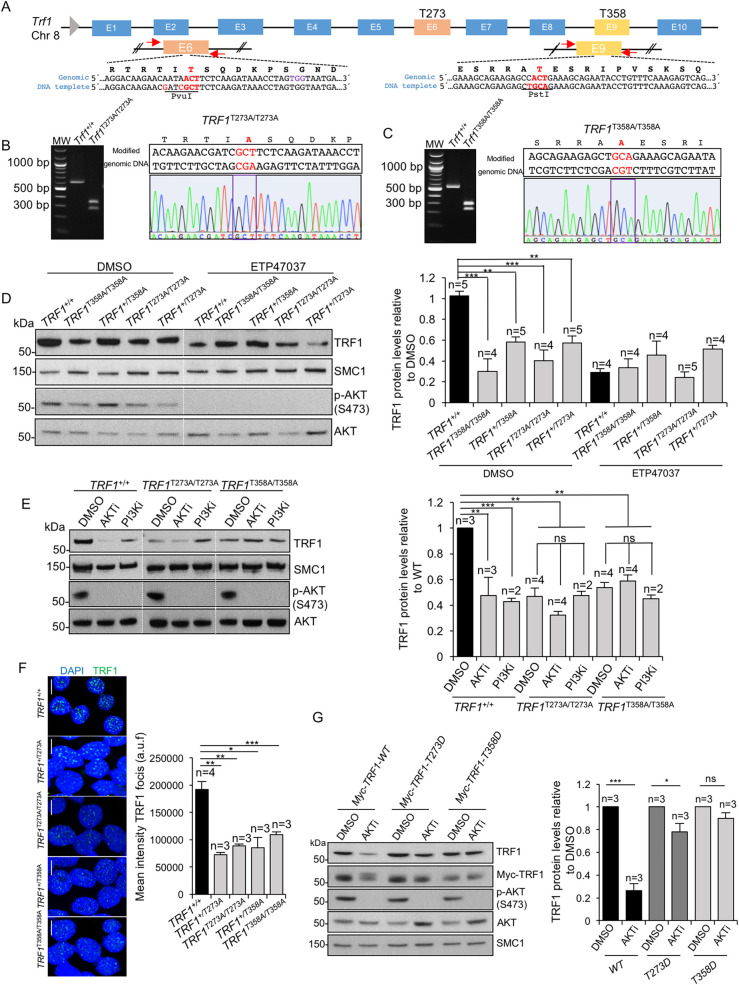
Fig 2. Generation of human TRF1 knock-in cell lines.
A. Graphical scheme of CRISPR-Cas9-based strategy followed to substitute the ACT codon for GCT in exon 6 and 9 to generate TRF1T273A and TRF1T358A alleles, respectively. The genomic and the template DNA sequence are shown where the nucleotide substitution for amino acid change and for novel restriction site introduction are indicated in red. B-C. The mutant TRF1T273A (A) and TRF1T358A (B) alleles were validated by RFLP analysis and Sanger sequencing. Representative images of ethidium bromide stained RFLP agarose gels (left panel) and of Sanger sequence spectrum (right panel) in TRF1T273A/T273A and TRF1T358A/T358A knock-in cells, respectively. D. Representative western blot images and quantification (right panel) of total nuclear of TRF1 protein levels in wild-type and heterozygous and homozygous mutant cells, treated either with DMSO or the PI3K inhibitor ETP47037 (10 μM). Phospho-AKT and total AKT were analyzed as positive control for the treatment. SMC1 was used as loading control. E. Representative western blot images and quantification (right panel) of total nuclear of TRF1 protein levels in wild-type and homozygous mutant cells, treated either with DMSO, AKT inhibitor MK22-06 (10 μM) or PI3K inhibitor ETP47037 (10 μM). Phospho-AKT and total AKT were analyzed as positive control for the treatments. SMC1 was used as loading control. F. Representative images and quantification (right) of TRF1 immunofluorescence in wild-type and mutant cells. Scale bars, 10 μm. G. Representative western blot images and quantification (right panel) of total nuclear of TRF1 protein levels in wild-type cells knocked down for endogenous TRF1 and overexpressing either wild-type MYC-tagged TRF1, MYC-tagged TRF1T273D or with MYC-tagged TRF1T358D alleles, treated either with DMSO or with AKT inhibitor MK22-06 (10 μM). Phospho-AKT and total AKT were analyzed as positive control for the treatment. SMC1 was used as loading control. Error bars represent standard deviation. n number of independent experiments. Student’s t test was used for statistical analysis, P values are shown. *, p ≤ 0.05; **, p ≤ 0.01; ***, p ≤ 0.001; n.s. = not significant.

