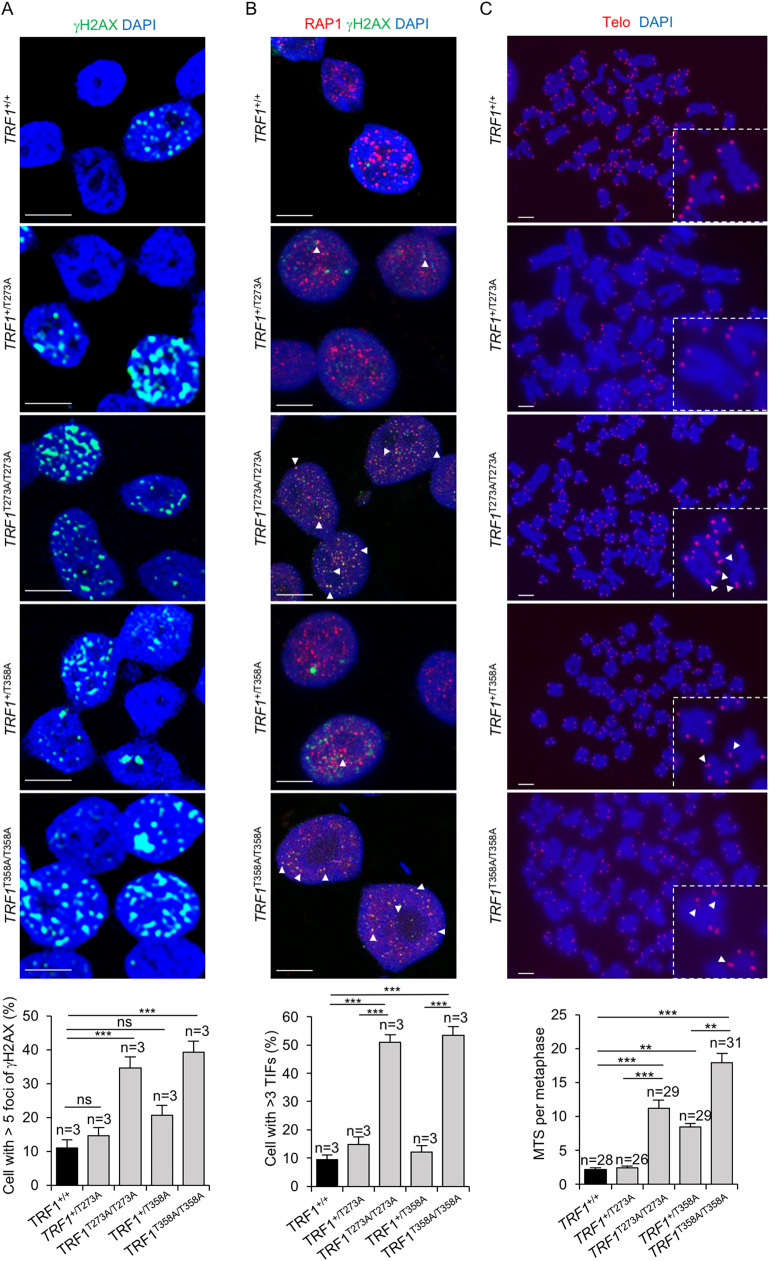
Fig 4. AKT-dependent TRF1 phosphorylation is required for telomere protection.
A. Representative images (above panel) and quantification (below panel) of percentage of ꝩH2AX positive cells in wild type, TRF1+/T273A, TRF1T273A/T273A, TRF1+/T358A and TRF1T358A/T358A cell lines. Scale bars, 10 μm. B. Representative images (above panel) and quantification (below panel) of percentage of cells presenting three or more ꝩH2AX and RAP1 co-localizing foci (TIFs) (white arrowhead). Scale bars, 10 μm. C. Representative images (above panel) and quantification (below panel) of multitelomeric signals (MTS) (white arrow heads). Insets represent high magnification images. Scale bars, 5μm. Error bars represent standard deviation. n number of independent experiments (A,B) or number of metaphases (C). Student’s t test was used for statistical analysis, P values are shown. *, p ≤ 0.05; **, p ≤ 0.01; ***, p ≤ 0.001.

