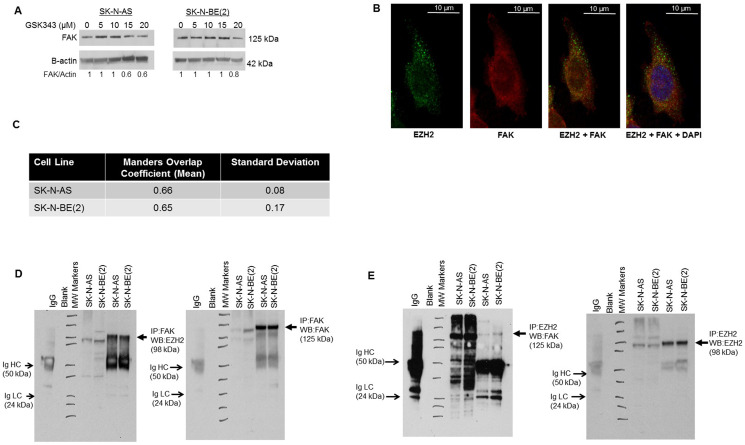
Fig 6. EZH2 and FAK association in neuroblastoma.
(A) SK-N-AS and SK-N-BE(2) cells were treated with increasing doses of GSK343 for 24 hours. Whole cell lysates were examined with immunoblotting. There was a dose dependent decrease in FAK expression. (B) Immunofluorescence staining followed by confocal microscopy was utilized to investigate EZH2 and FAK interaction in SK-N-AS and SK-N-BE(2) cell lines. Representative photographs of SK-N-AS cells are presented. There was an overlap in staining between EZH2 (green, first panel) and FAK (red, second panel), depicted as yellow color (third panel), indicating an interaction. DAPI staining was completed to identify the nucleus (fourth panel). White scale bars represent 10 μm. (C) To quantitate overlap, Manders overlap coefficients were calculated for SK-N-AS (0.66) and SK-N-BE(2) (0.65) cells. These values were greater than 0, providing evidence of an interaction between EZH2 and FAK. (D) Immunoprecipitation with FAK followed by Western blotting for EZH2 was used to demonstrate an interaction between FAK and EZH2 (lanes 6, 7, closed arrows). (E) The reverse, immunoprecipitation for EZH2 followed by Western blotting for FAK revealed an interaction between EZH2 and FAK (lanes 6, 7, closed arrows). IgG served as a control. IgG heavy chain (HC) and light chain (LC) bands are indicated on the blots (open arrows). Whole cell lysates without IP were included on each of the blots (lanes 4, 5).

