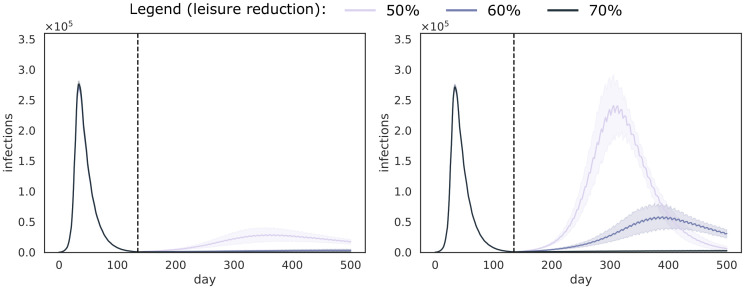
Fig 5. Trends for different leisure contact reductions, when performing weekly universal testing, and importing 10 cases per day.
We assume that universal testing starts (and lock-down ends) on the first of July, as marked by the vertical dotted line, and that FNRPCR = 0.1. We consider both isolation strategies: pool isolation (left panel) and individual isolation (right panel). The curves show a line that depicts the average over the trajectories of the result aggregations and a shaded area that depicts the standard deviation.

