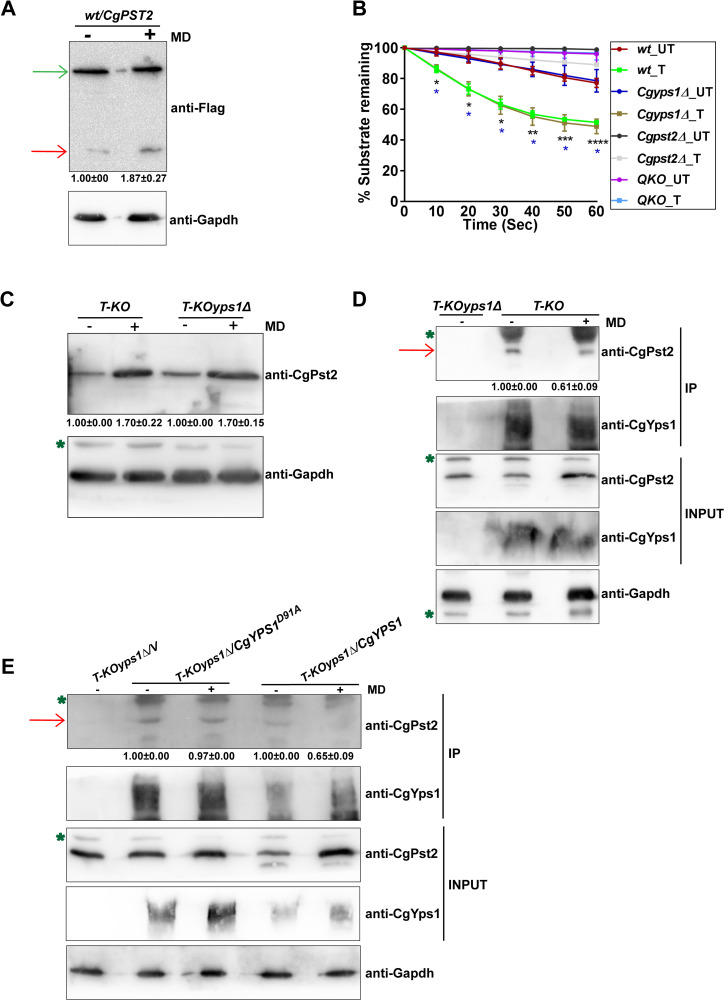
Fig 4. The cleavage and NADH:quinone oxidoreductase activity of CgPst2 is increased upon menadione treatment.
A. Immunoblot analysis of CgPst2 expression, using anti-Flag antibody, in cell extracts of untreated or menadione-(MD; 90 μM for 90 min)-treated log-phase cells of the wt strain expressing CgPst2-SFB, using anti-Flag antibody. CgGapdh was used as a loading control. The intensity of the shorter 16 kDa band in 4 independent Western blots was quantified using the ImageJ densitometry software, and this signal was normalized to the corresponding CgGapdh-normalized total CgPst2 signal, as total CgPst2 levels were also elevated, upon MD treatment, compared to CgGapdh signal. Data (mean ± SEM) represent the fold-change in levels of the C-terminal cleaved fragment of CgPst2-SFB in treated cells, compared to untreated cells (considered as 1.0), and are shown underneath the blot. p ≤ 0.05; paired two-tailed Student’s t test. The red and green arrows indicate the C-terminal cleaved fragment of CgPst2 and full length CgPst2-SFB, respectively. B. NADH:quinone oxidoreductase activity in log-phase cultures of indicated C. glabrata strains that were either treated with 90 μM menadione (T) for 90 min, or left untreated (UT), as measured using menadione (500 μM) and NADH (500 μM) substrates. Absorbance of the substrate NADH was considered as 100 at 0 h time point, and NADH oxidation was deduced from the formula: [(absorbance at each time point/0 h absorbance) X 100]. Black and blue asterisks indicate statistically significant differences in activity of treated wt and Cgyps1Δ samples, respectively, compared to respective untreated lysates. The Q-KO strain lacks four flavodoxin-like proteins, CgPst2, CgRfs1, CgPst3 and CgYcp4. *, p < 0.0332; **, p < 0.0021; ***, p < 0.0002; ****, p < 0.0001; Grouped multiple t-test (n = 3 to 5). C. Immunoblot analysis of CgPst2 levels in T-KO (Cgrfs1Δpst3Δycp4Δ) and T-KOyps1Δ (Cgrfs1Δpst3Δycp4Δyps1Δ) cells, using anti-CgPst2 antibody. The intensity of individual bands in 4 independent Western blots was quantified using ImageJ densitometry software, and CgPst2 signal was normalized to the corresponding CgGapdh signal. Fold-change (mean ± SEM) in CgPst2 levels in treated cells, compared to untreated cells (considered as 1.0), is shown underneath the blot. p ≤ 0.05; paired two-tailed Student’s t test. The green asterisk indicates non-specific band. D-E. Immunoblot analysis showing CgYps1-CgPst2 (D) and CgYps1-CgYps1D91A-CgPst2 (E) interaction upon MD treatment (90 μM for 90 min) in T-KO (Cgrfs1Δpst3Δycp4Δ) and T-KOyps1Δ (Cgrfs1Δpst3Δycp4Δyps1Δ) cells, using anti-CgPst2 antibody. 6 mg precleared cell lysates were incubated with anti-CgYps1 antibody-conjugated beads for 12 h at 4°C. After bead washing, bead-bound proteins were boiled in 2X-SDS loading buffer and resolved on 4–20% polyacrylamide gradient and 12% polyacrylamide gels for CgYps1 and CgPst2 samples, respectively. For input samples, 60, 60 and 200 μg protein were loaded to detect CgPst2, CgGapdh and CgYps1 proteins, respectively. Two to three independent Western blots were quantified using the ImageJ densitometry software, and CgPst2 signal was normalized to the corresponding CgGapdh signal. Fold-change in CgPst2 levels in treated cells, compared to untreated cells (considered as 1.0), is shown underneath the blot. p ≤ 0.05; paired two-tailed Student’s t test. The red arrow marks CgPst2 band, while the green asterisk denotes non-specific band.

