Figure1.
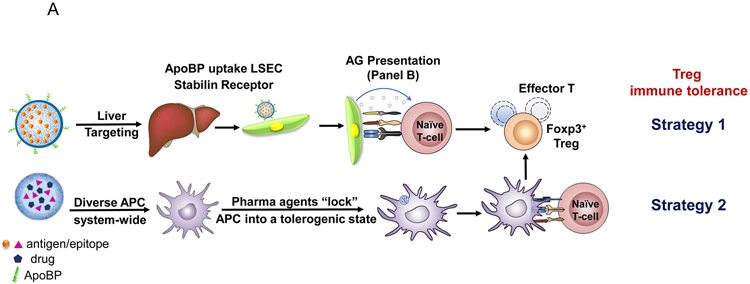
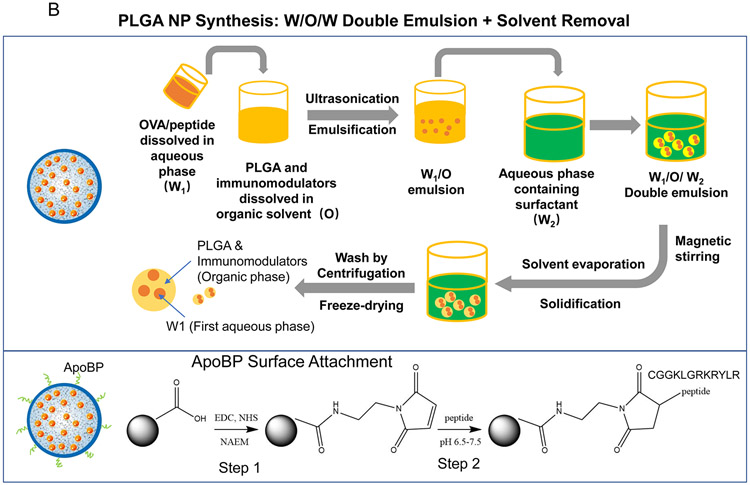
(A) Schematic showing two main potential strategies for inducing immune tolerance. (A) Strategy 1 depicts a liver-targeting nanoparticle for allergen delivery to LSEC in the liver, where allergen processing and presentation to naïve T-cells induce antigen-specific Foxp3+ Tregs, which are recruited to the site of allergic inflammation in the lung. Strategy 2 shows nanoparticles with/without allergen encapsulation to be co-loaded with pharmaceutical agents that are capable of locking non-targeted APCs, which are distributed system-wide into a tolerogenic state. (B) Schematic showing the PLGA nanoparticle synthesis process, including carrier cargo loading (allergen, epitopes, pharmaceutical agents), using a w/o/w double emulsion method combined with solvent removal. The lower panel describes the ApoBP peptide surface attachment onto the particle surface by a NAEM spacer, using a two-step conjugation process to link the ApoBP cysteine group to the NAEM maleimide group.39 (C) The schematic in the left panel shows a working model for liver-targeting tolerogenic nanoparticles. Particles in the ~200 nm size range and attached ApoBP ligand deliver the antigens are epitopes to LSECs in the liver through endocytic uptake. Antigen processing and presentation to naïve T-cells are capable of generating Foxp3+ Tregs, which are recruited to the site of pathology, where they exert their immunosuppressive effects.39 The middle panel shows representative ex vivo IVIS images of the explanted hearts, livers, spleens, lungs, and kidneys collected from animals (24 h after injecting with 500 μg decorated or non-decorated NPs, containing 25 μg Dylight680-labeled OVA (n=4) in an independent experiment to confirm our previous findings.39 The detailed methodology was included in the supporting information. The right panel shows the use of confocal microscopy that reflects the intrahepatic distribution of free and encapsulated OVA. The red and green fluorescence colors represent Dylight680-labeled OVA and isolectin B4 stained LSECs, respectively.39 Quantification of the colocalization between OVA and LSECs was carried out using the calculation of Pearson’s correlation coefficient. Data are expressed as the mean ± SEM.


