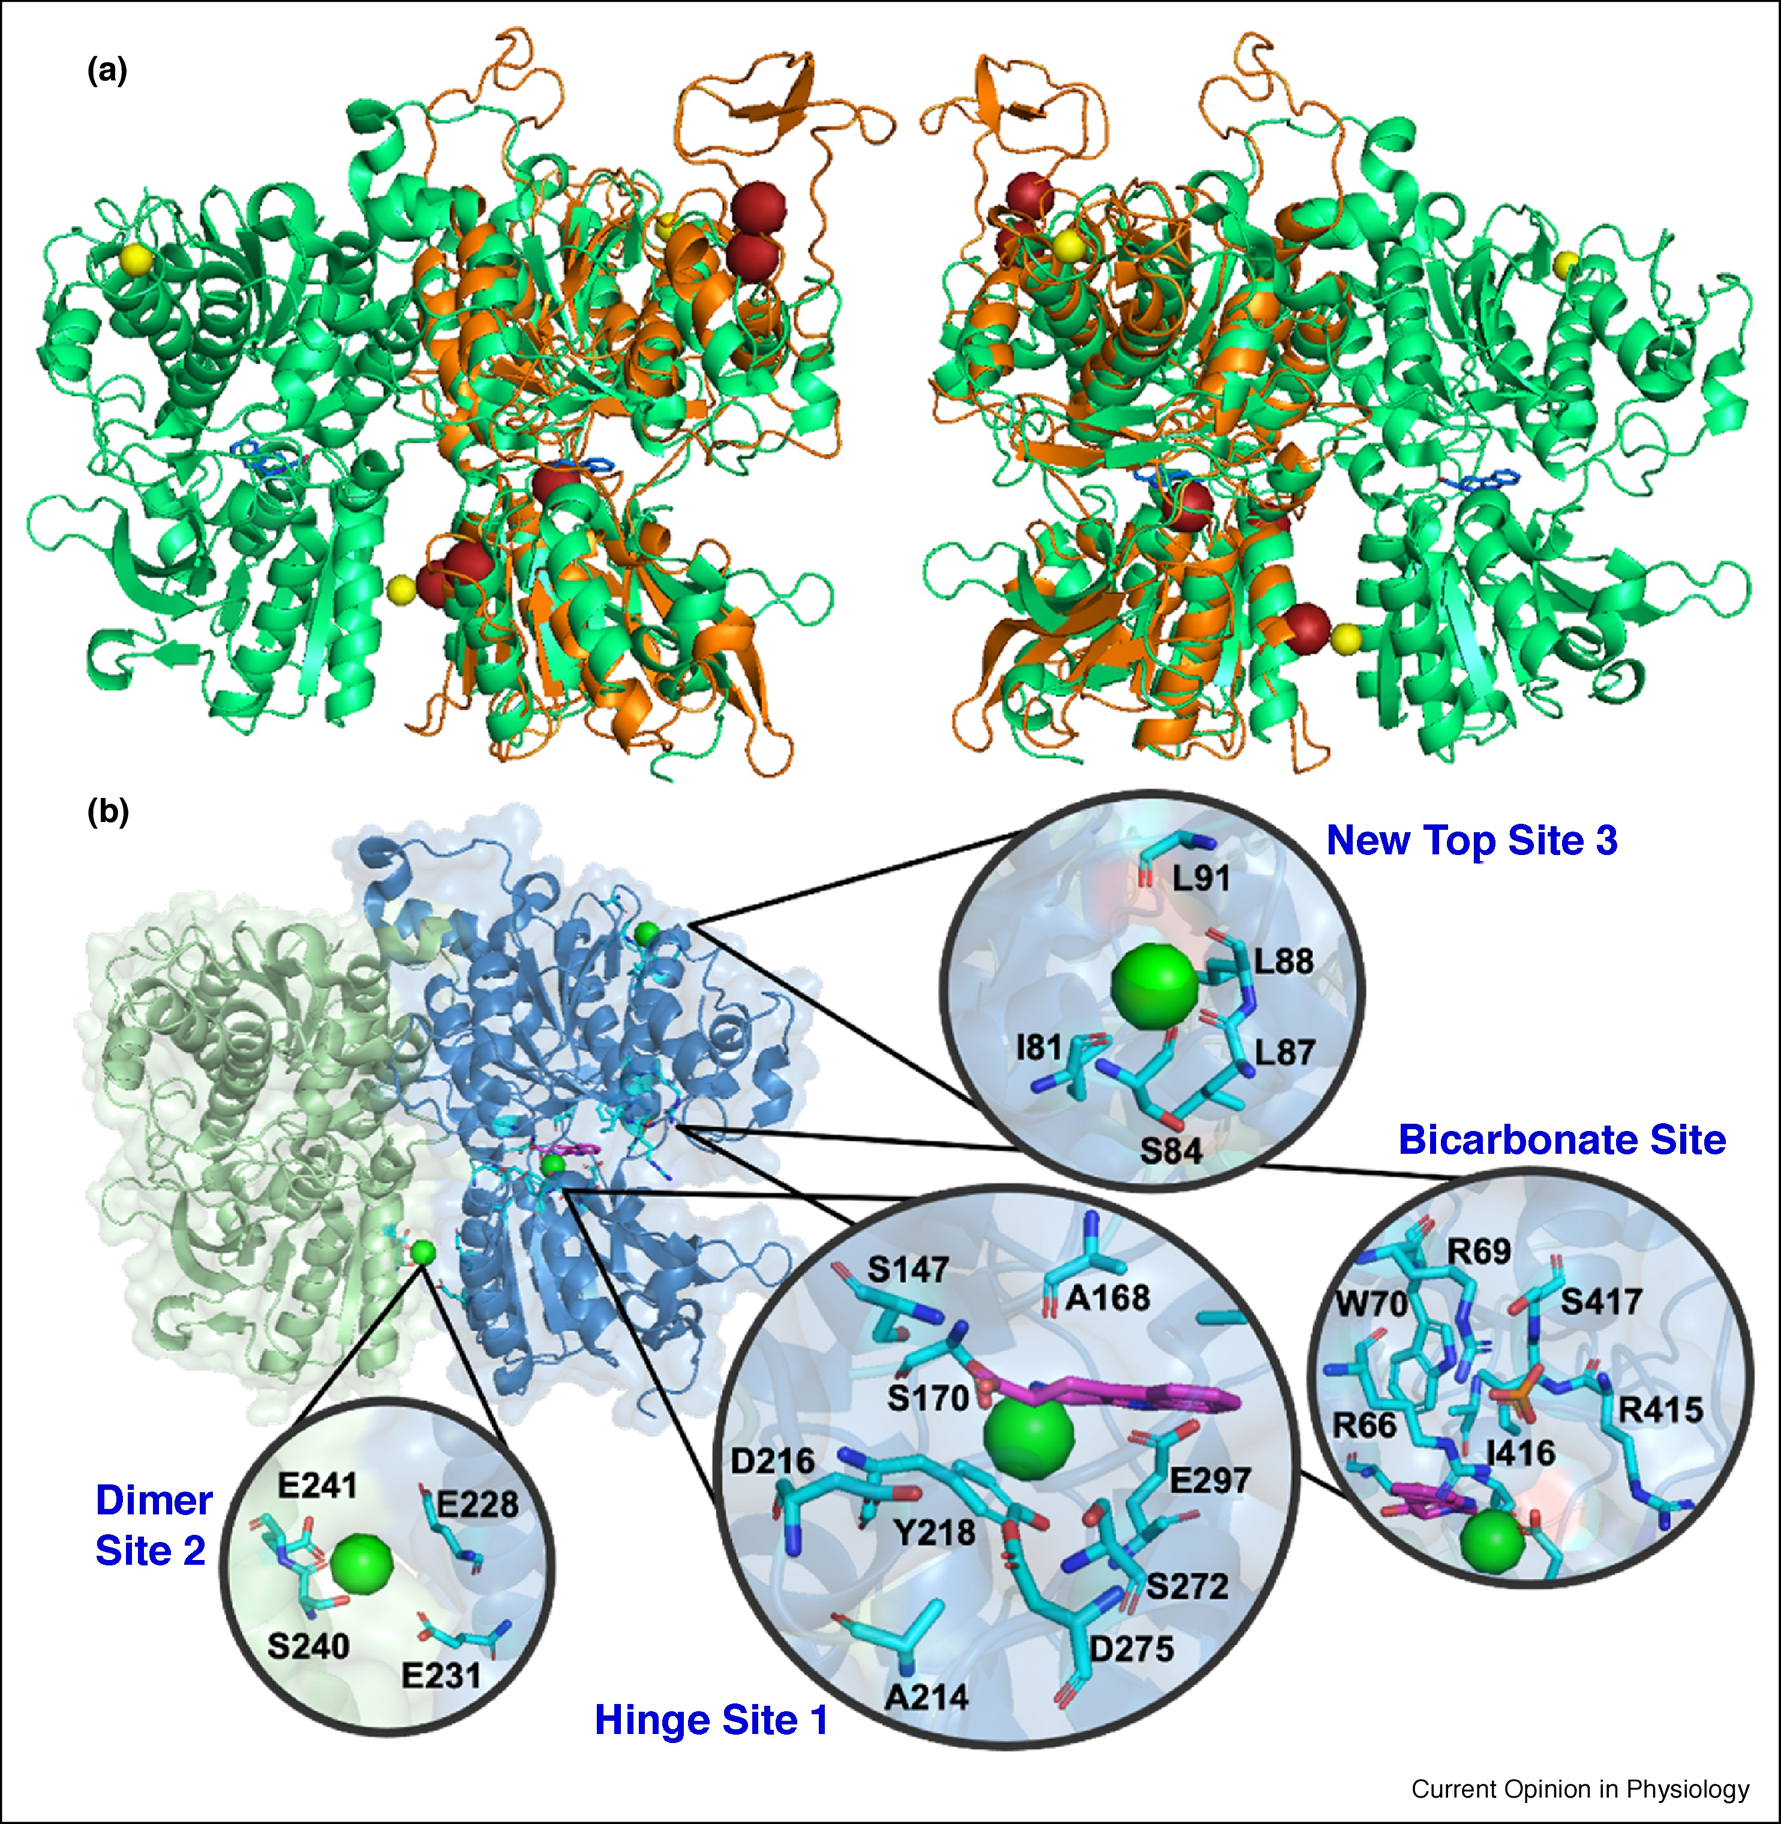
Fig. 1.

(A) Overlapping structures of modeled ECD (orange) and determined structure (PDB ID 5FBK). Mg2+ and putative Ca2+ are shown in yellow and red spheres respectively. (B) X-ray Structure of CaSR ECD (PDB ID 5FBK) and key areas to be studied with zoomed Mg2+ Site I, Mg2+ Site II, Mg2+ new Site, hinge ligand binding site and anion binding site. Green spheres represent Ca2+. bicarbonate is shown in orange sticks. TNCA is indicated by magenta sticks.
