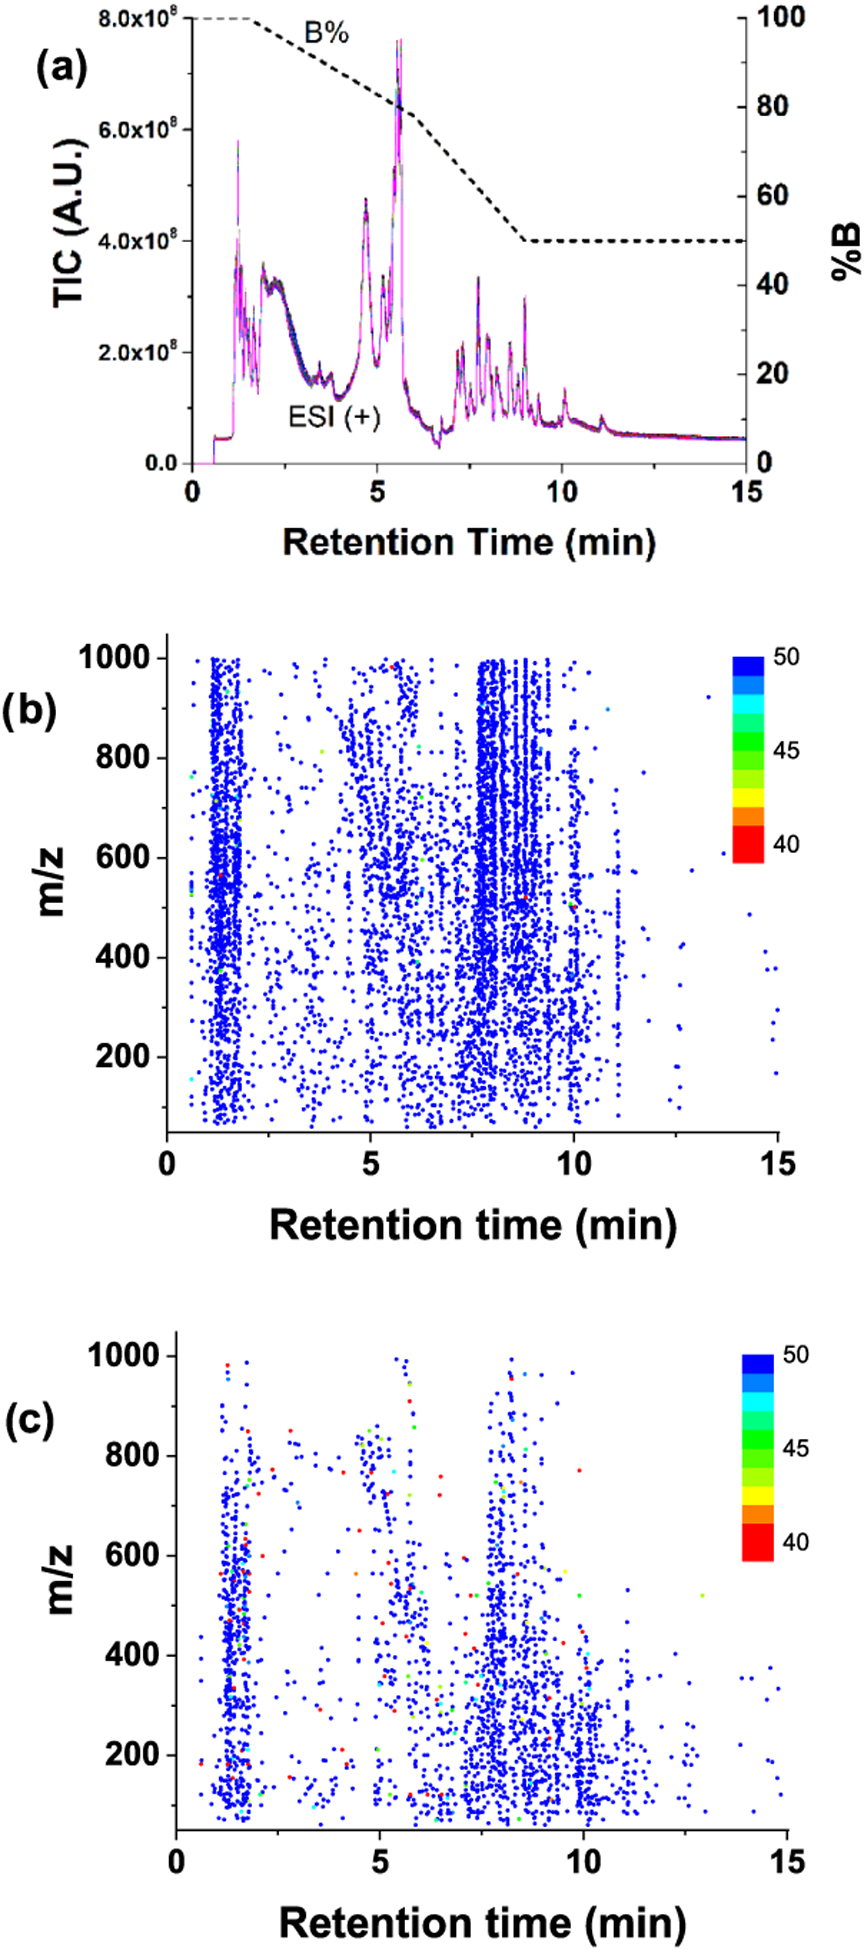
Figure 1.

(a) Total ion count (TIC) chromatograms of 50 QC repetitions. Profile data and centroid data were processed, and the extracted compounds are shown in (b) and (c), respectively. Every compound was defined as having at least two ions, and a peak width of ≥3 s, as described in the main text. The color gradient indicates the detection frequency of compounds. Compounds detected in less than 40 samples (80%) were also marked as 40. Note: for plotting a, nonvarying signals observed in the blank were subtracted to reduce the offset.
