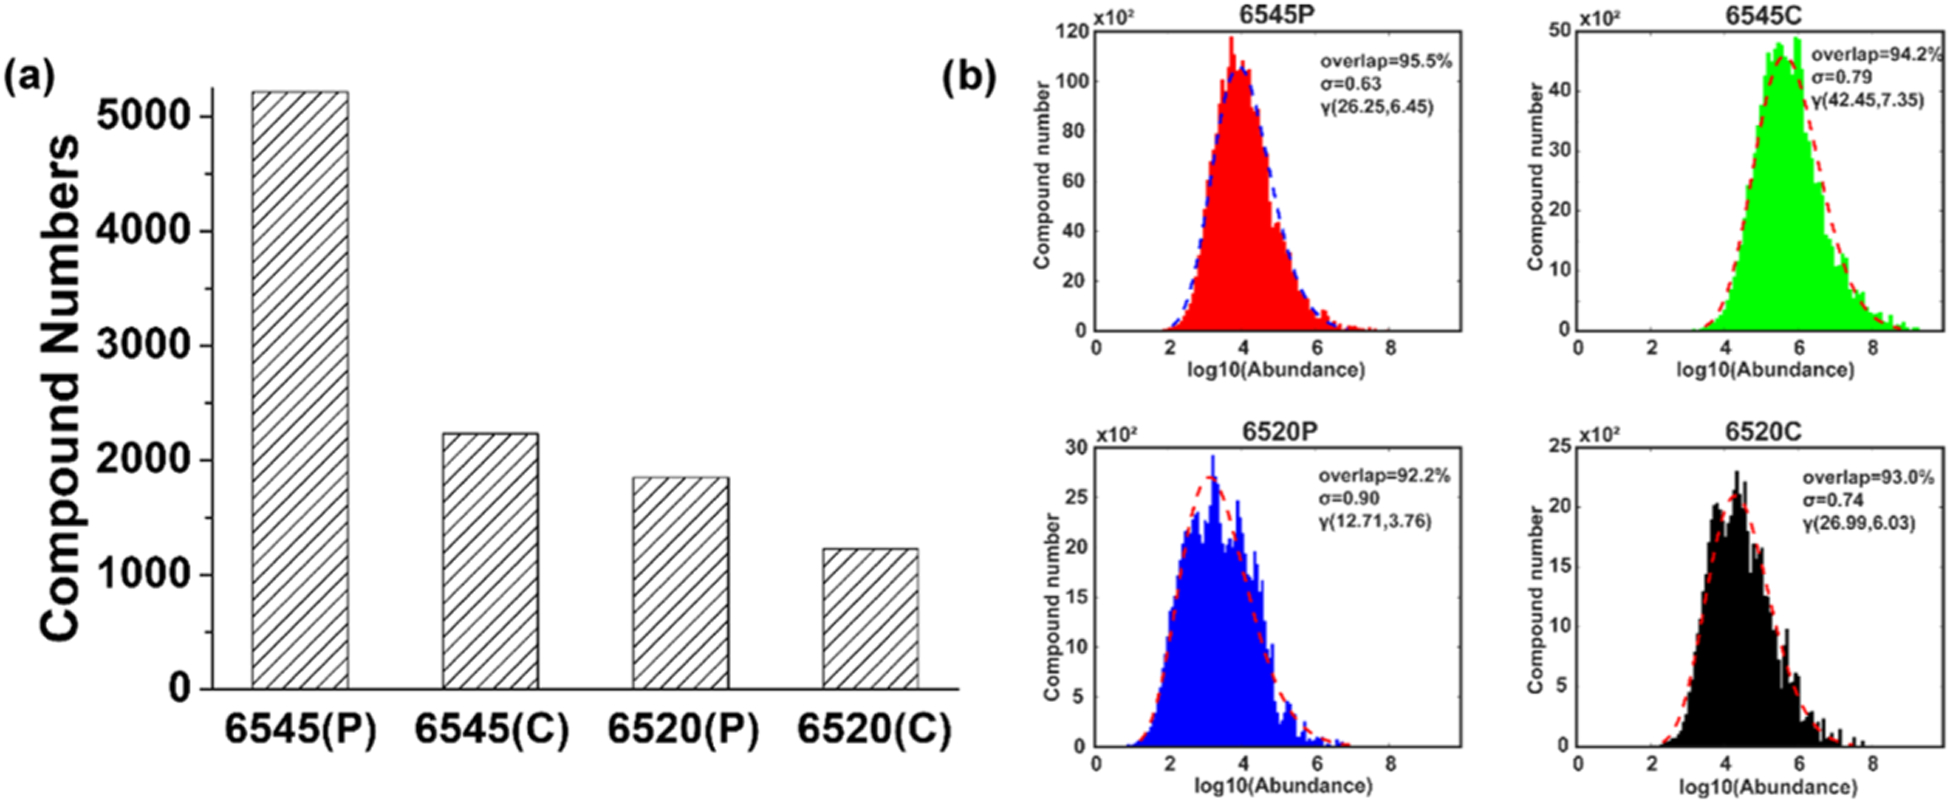
Figure 2.

(a) Numbers of compounds extracted by Progenesis QI from the two different instrument platforms, 6545 and 6520, and either profile (P) or centroid (C) mode. (b) Compound numbers versus log10(abundance) and γ distribution γ(α, β) fits for the four types of data. The percentage of the overlapped area between the histogram and γ distributions is shown in each of the plots along with the standard deviation σ and the two parameters α and β.
