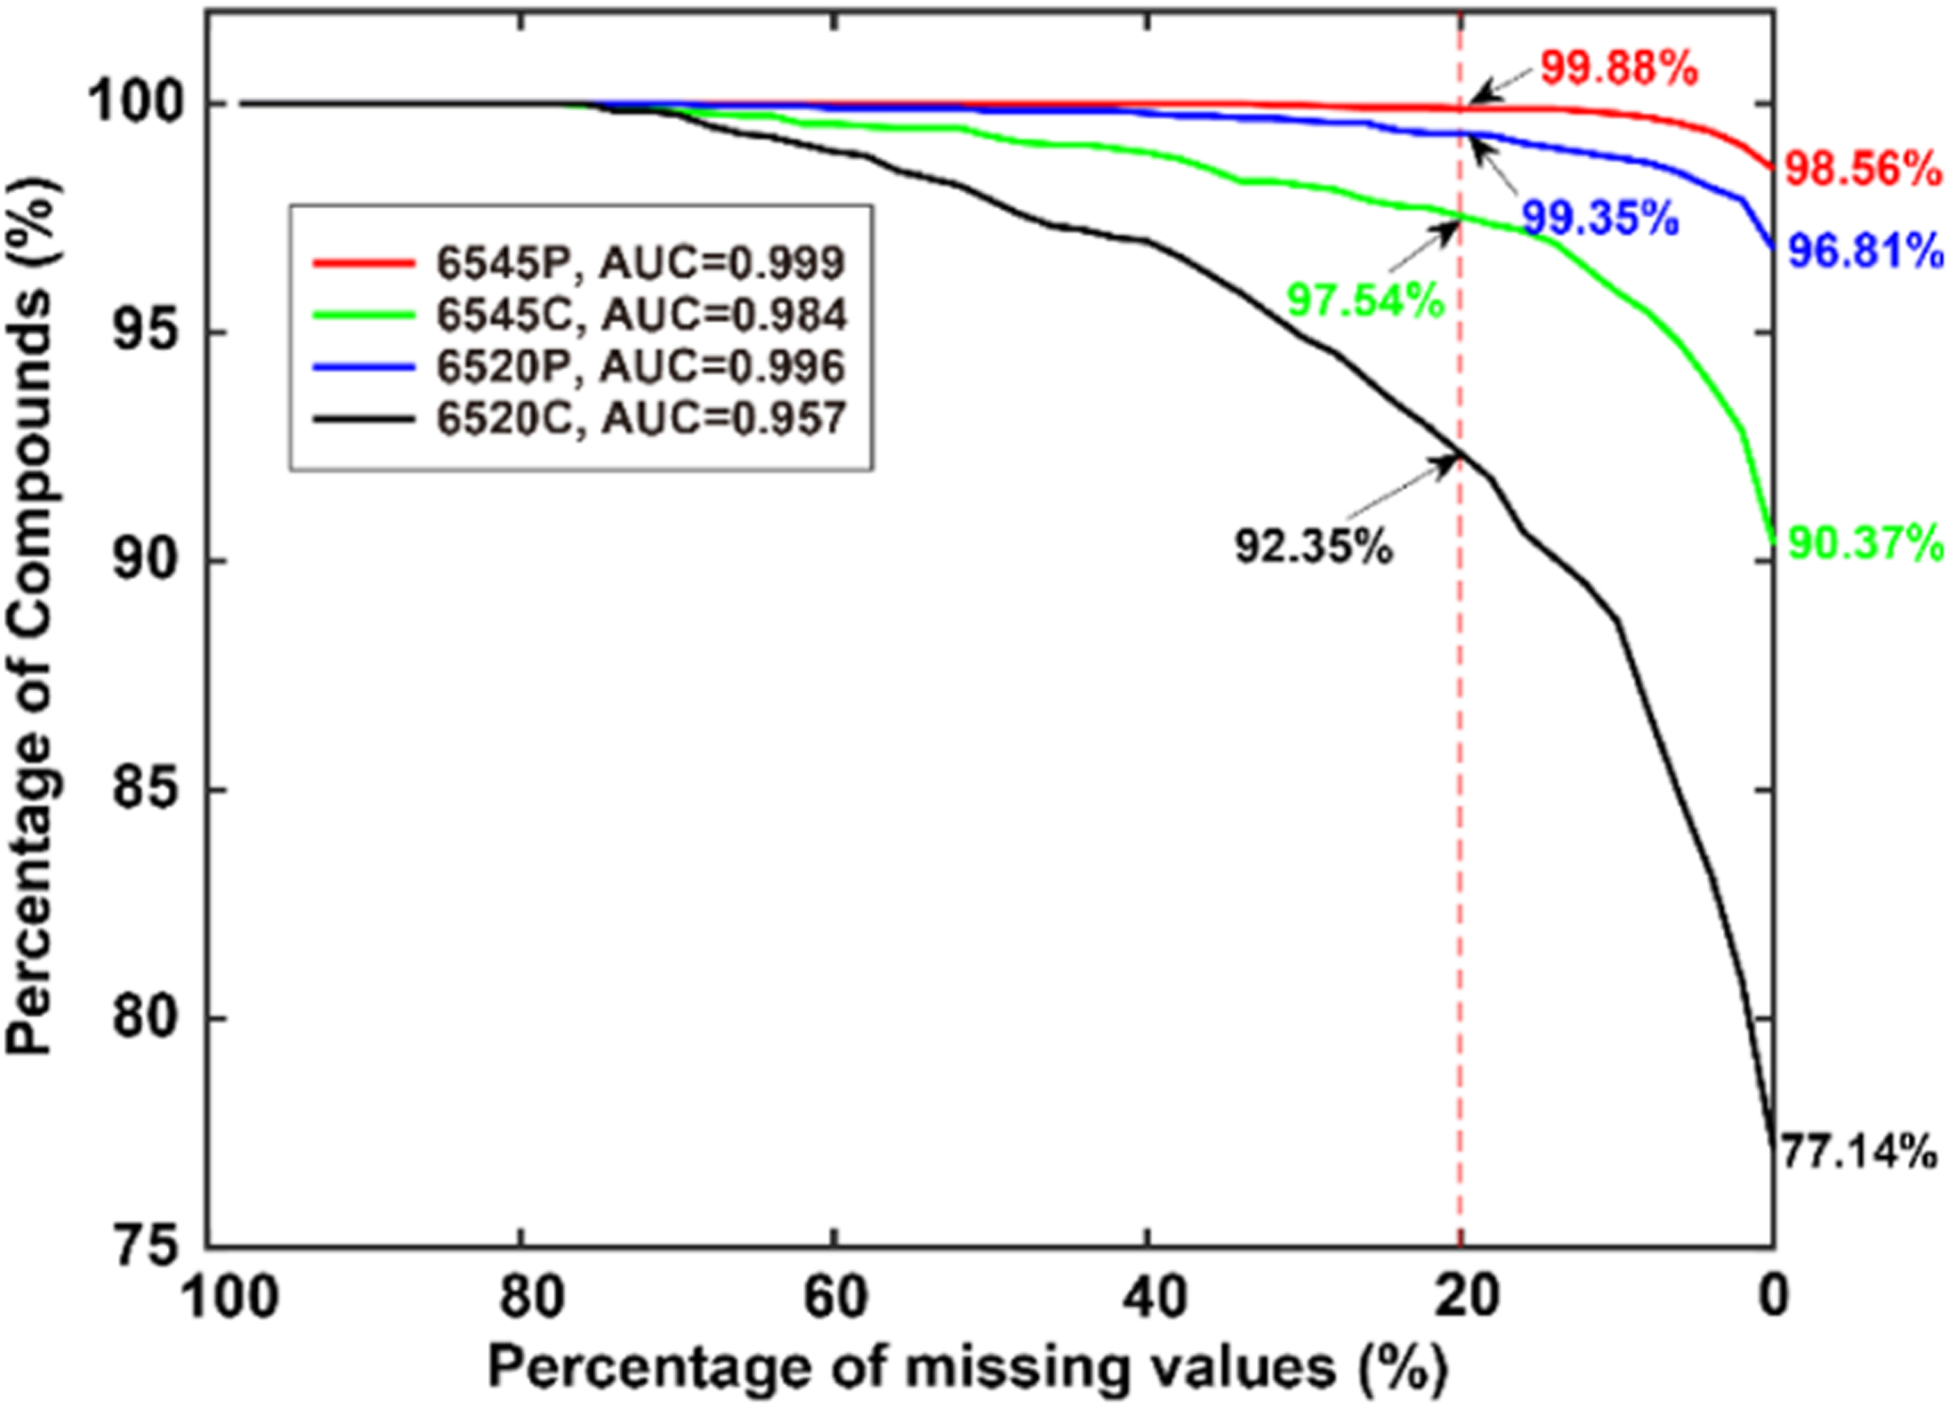
Figure 3.

Missing values are visualized by plotting the percentage of compounds detected versus the percentage of missing values. As shown in the figure, 98.56% of the compounds were detected in all samples by the 6545(P) platform, while 99.88% of the compounds were detected with a missing rate of up to 20%. Poorer performance was seen, especially for the centroid data sets. Area under the curve (AUC) values are also provided.
