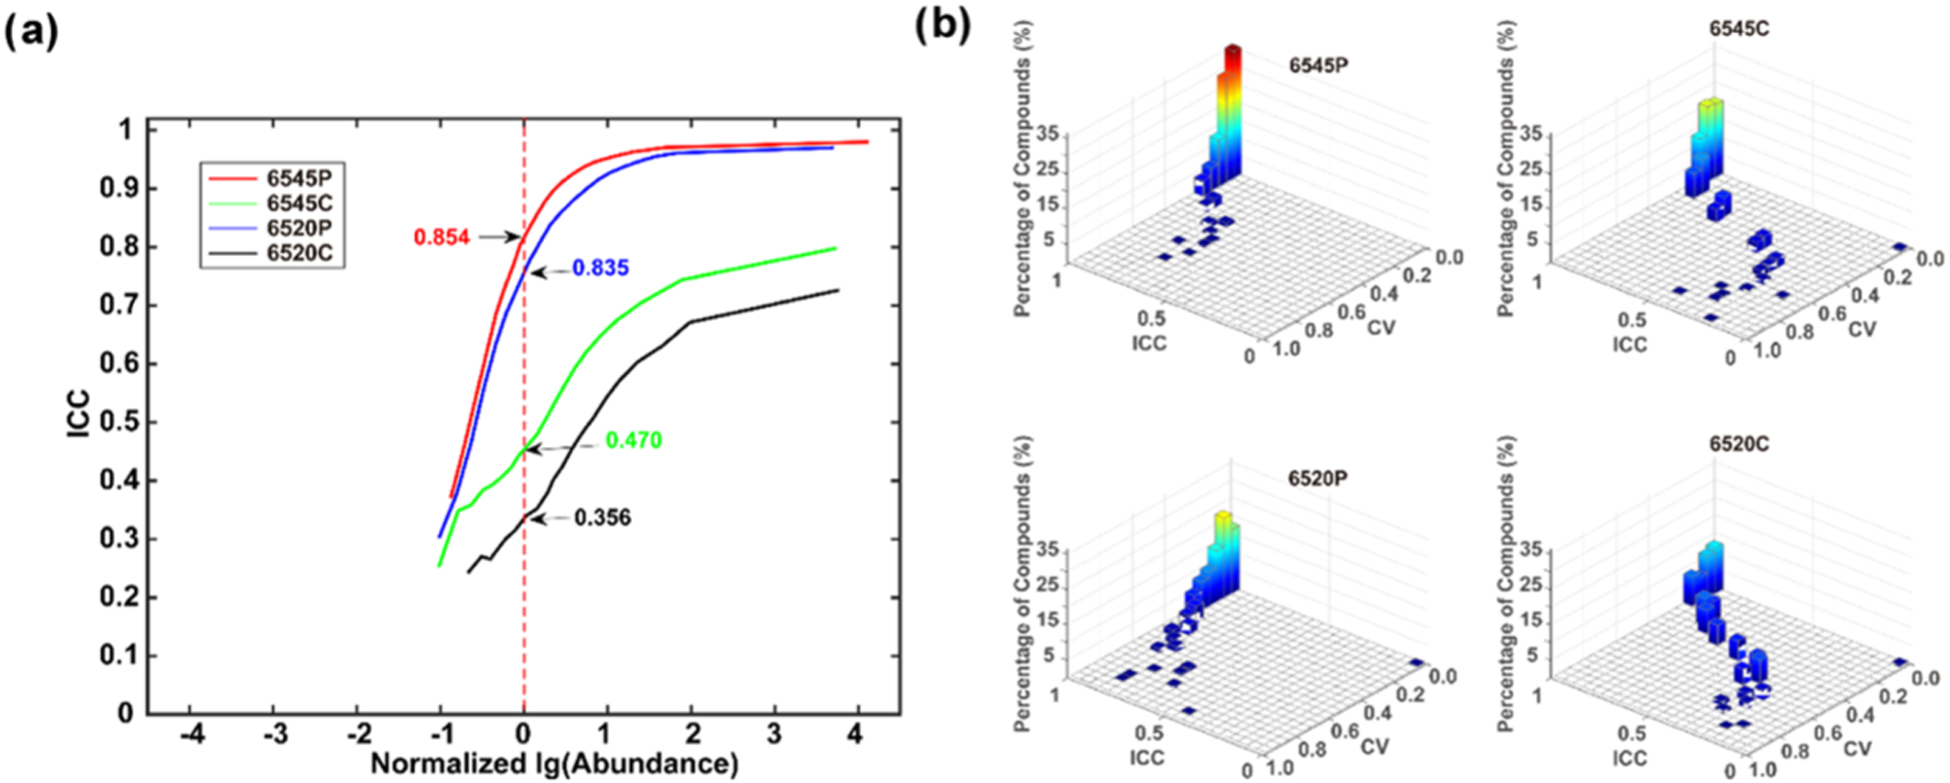
Figure 5.

(a) ICC values versus percentages of compounds sorted by abundance for the 50 sample data set. The graph is normalized by setting the log10(abundance) = 0, where the number of detected metabolites is maximum. (b) 3-D plot of ICC versus CV and % compounds divided into 20 fractions along each axis.
