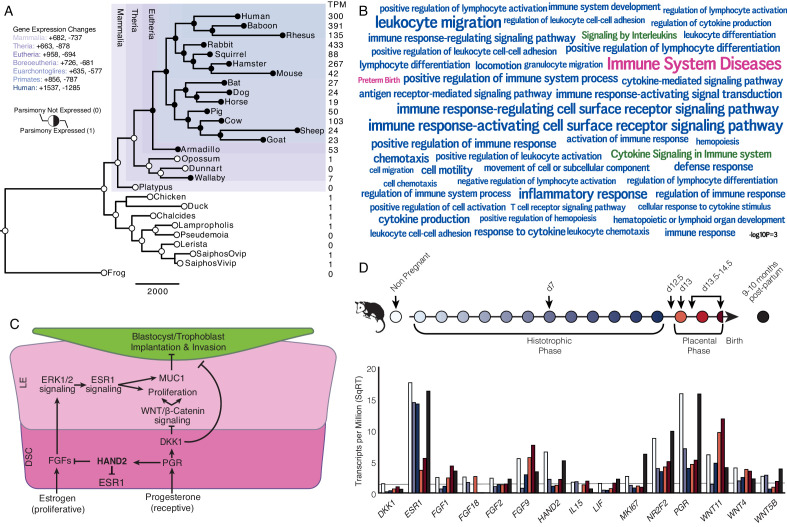
Figure 1. Recruitment of HAND2-mediated anti-estrogenic signaling in the Eutherian endometrium.
(A) Evolution of HAND2 expression at the maternal-fetal interface. Amniotes phylogeny with horizontal branch lengths drawn proportional to the number of gene expression changes inferred by parsimony (most parsimonious reconstruction). Circles indicate HAND2 expression in extant species and ancestral reconstructions. Black, expressed (state = 1). White, not expressed (state = 0). Inset legend shows the number of most gene expression changes from the root node to human (+ = gene expression gained; - = gene expression lost). Numbers to the right indicate HAND2 expression in TPM for each respective species. (B) WordCloud of biological pathways (green), human disease phenotypes (pink), and biological process gene ontology terms (blue) enriched among 149 unambiguously recruited genes in the Eutherian stem-lineage. Term size is shown scaled to -log10 p-value (see inset scale). (C) Cartoon model of estrogen signaling and HAND2-mediated anti-estrogenic signaling in the endometrium. The estrogen-mediated signaling network is suppressed by progesterone through the activation of HAND2 and antagonists of canonical WNT/β-catenin-mediated signaling pathways such as DKK1. In the proliferative phase of the reproductive cycle, estrogen acts through ESR1 in stromal cells to increase the production of fibroblast growth factors (FGFs), which serve as paracrine signals leading to sustained proliferation of epithelial cells. Active estrogen signaling maintains epithelial expression of Mucin 1 (MUC1), a cell surface glycoprotein that acts as a barrier to implantation. During the receptive phase of the cycle, however, progesterone induces HAND2 and DKK1 expression in the endometrial stroma, inhibiting production of FGFs, suppressing epithelial proliferation and antagonizing estrogen-mediated expression of MUC1, thereby promoting uterine receptivity to implantation. DSC = decidual stromal cells, LE = luminal epithelium. (D) Gene expression time course through opossum pregnancy. Upper, schematic of gestation length in Monodelphis domestica in which the histotrophic phase lasts from day 1 to day 12, hatching occurs on day 12.5, the placental phase lasts from day 13 to day 14.5, and birth occurs on day 14.5. Lower, data shown as square root (SqRT) transformed TPM. The TPM = 2 expression cutoff is shown as a horizontal gray line. M. domestica RNA-Seq data from Lynch et al., 2015; Hansen et al., 2016; Griffith et al., 2017; Griffith et al., 2019.
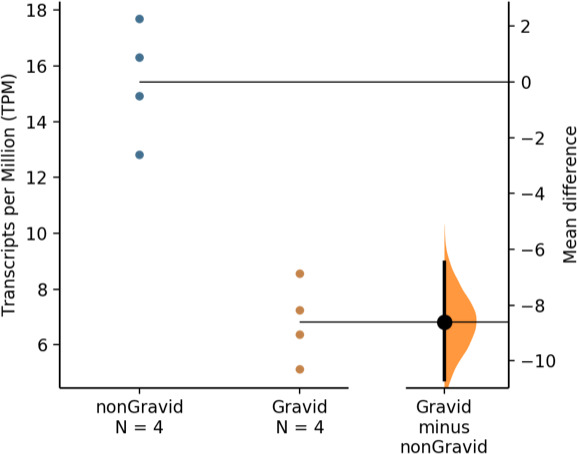
Figure 1—figure supplement 1. The unpaired mean difference in HAND2 expression between non-Gravid and Gravid wallaby samples is −8.6 [95.0% CI: −10.7 – −6.46].

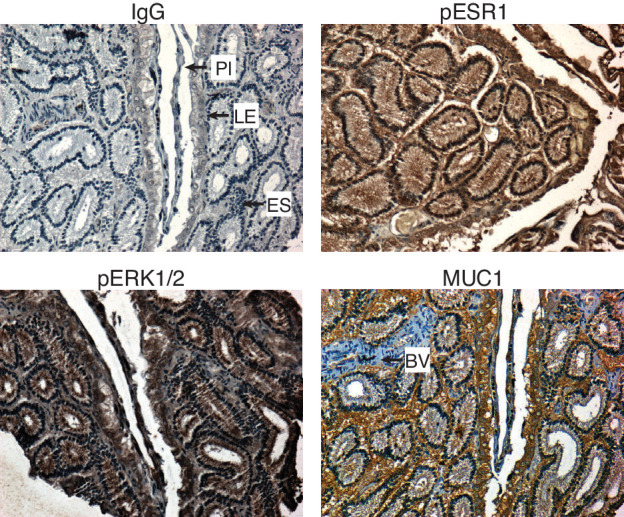
Figure 1—figure supplement 2. Immunohistochemistry showing phosphorylated ESR1 (pESR1), phosphorylated MAPK1/2 (pERK1/2) and MUC1 expression in paraffin-embedded 12.5d pregnant Monodelphis domestica endometrium compared to control (IgG).


