. 2021 Feb 1;10:e63364. doi: 10.7554/eLife.63364

Figure 1. Deep mutagenesis of amyloid beta (Aß) nucleation.

(A) In vivo Aß selection assay. Aß fused to the Sup35N domain seeds aggregation of endogenous Sup35p causing a read-through of a premature UGA in the Ade1-14 reporter, allowing the cells to grow in medium lacking adenine. (B) Correlation of nucleation scores for biological replicates 1 and 2 for single and double amino acid (aa) mutants. Pearson correlation coefficient and p-value are indicated (Figure 1—figure supplement 1B) n = 10,157 genotypes. (C) Correlation of nucleation scores with in vitro primary and secondary nucleation and elongation rate constants (Yang et al., 2018). Weighted Pearson correlation coefficient and p-value are indicated. (D) Nucleation scores as a function of principal component 1 (PC1) aa property changes (Bolognesi et al., 2019) for single and double aa mutants (n = 14,483 genotypes). Weighted Pearson correlation coefficient and p-value are indicated. (E) Solubility scores (Gray et al., 2019) as a function of PC1 changes (Bolognesi et al., 2019) for n = 895 single and double mutants. Pearson correlation coefficient and p-value are indicated.

Figure 1.

Figure 1—figure supplement 1. Reproducibility of the assay and correlation with in vitro fibril nucleation.

Figure 1—figure supplement 1.

(A) Percentage of yeast growth in medium lacking adenine for sup35N, amyloid beta (Aß) and sup35N-Aß constructions. (B) Correlation of nucleation scores for biological replicates 1 and 3 (n = 4,124 genotypes) and 2 and 3 (n = 4093) for single and double amino acid (aa) mutants. Pearson correlation coefficient and p-value are indicated. (C) Correlation of nucleation scores with in vitro combined rate constants for primary nucleation, secondary nucleation, conversion of secondary nuclei and saturation of secondary nucleation (Yang et al., 2018). Weighted Pearson correlation coefficient and p-value are indicated. (D) Correlation of solubility scores (Yang et al., 2018) with in vitro combined rate constants for primary nucleation, secondary nucleation, elongation, conversion of secondary nuclei, and saturation of secondary nucleation (Yang et al., 2018). Weighted Pearson correlation coefficient and p-value are indicated.
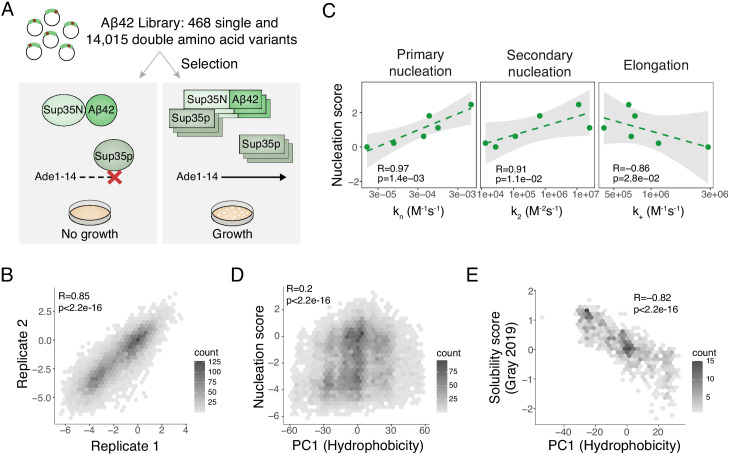
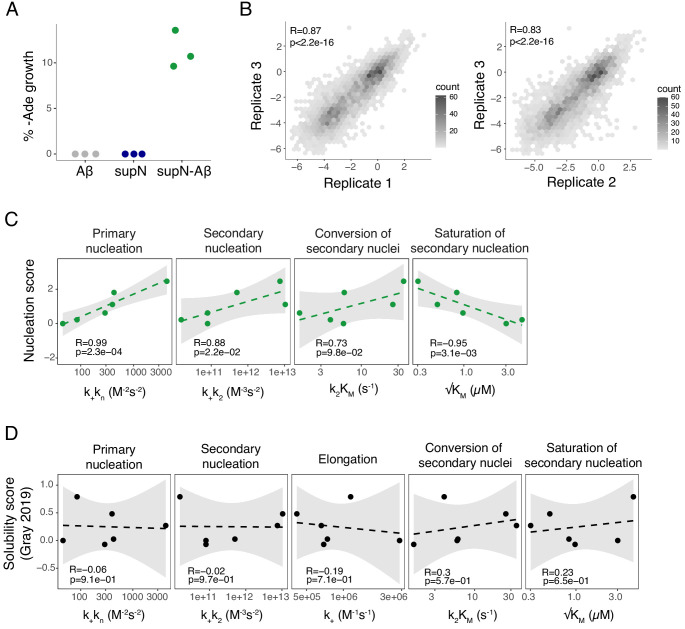
Figure 1—figure supplement 1—source data 1. Raw colony counts from independent testing of the strains expressing the variants reported in Figure 1—figure supplement 1A.