. 2021 Feb 24;10:e61525. doi: 10.7554/eLife.61525

Figure 1. Förster resonance energy transfer (FRET) assay to monitor peptidoglycan synthesis in real time.

(A) Scheme of the reactions of a class A penicillin-binding protein (PBP) (GTase-TPase) with unlabelled lipid II and the two versions of labelled lipid II, yielding a peptidoglycan (PG) product that shows FRET. (B) SDS-PAGE analysis of PG products by PBP1BEc (0.5 µM) reactions with unlabelled lipid II, Atto550-labelled lipid II, and Atto647n-labelled lipid II at a 1:1:1 molar ratio (each 5 µM), in the absence of antibiotics (I, red) or in the presence of 1 mM ampicillin (II, blue) or 50 µM moenomycin (III, yellow). Samples were incubated for 1 hr at 37°C and boiled for 5 min. (C) Representative fluorescence emission spectra taken after reactions performed as described in B and following the same labelling pattern. (D) FRET efficiency for PBP1BEc reactions carried out as indicated in B, calculated using the (ratio)A method (see Materials and methods). Values are mean ± SD of at least three independent samples. (E) Representative reaction curves from FRET assays of detergent-solubilized PBP1BEc. The same components as indicated in B were incubated in the presence or absence of 2 µM LpoB(sol). Reactions were performed in the absence of antibiotic (left), with 1 mM ampicillin (Amp) or 50 µM moenomycin (Moe) (middle), or by omitting unlabelled lipid II (right). The numbers indicate the corresponding lane of the gel in Figure 1—figure supplement 2D. Samples were incubated for 1 hr at 25°C. (F) Averaged initial slopes from reaction curves obtained by the FRET assay for detergent-solubilized E. coli PBP1B in the presence (blue) or absence (red) of LpoB, and in the presence or absence of ampicillin. Values are normalized relative to the slope in the absence of activator for each condition and are mean ± SD of 2–3 independent experiments.

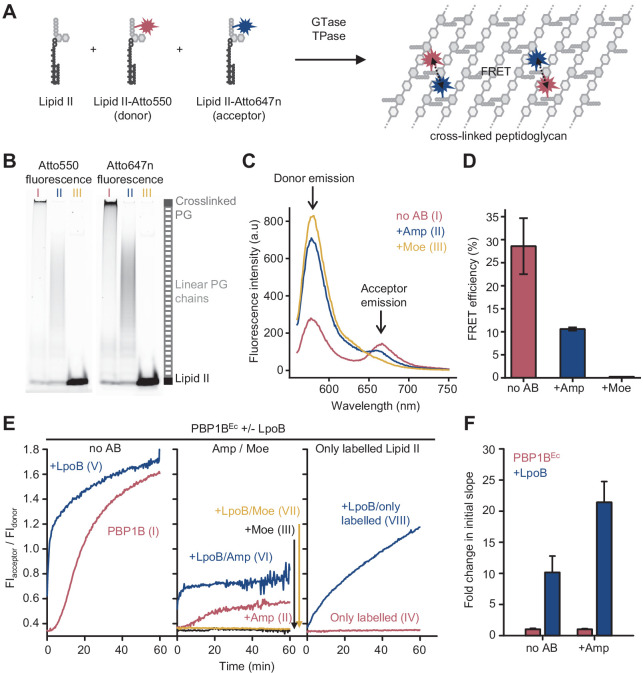
Figure 1—source data 1. Numerical data to support graphs in Figure 1 and original gel images for Figure 1B.

Figure 1.

Figure 1—figure supplement 1. Fluorescent lipid II analogues to monitor peptidoglycan synthesis in real time.

Figure 1—figure supplement 1.

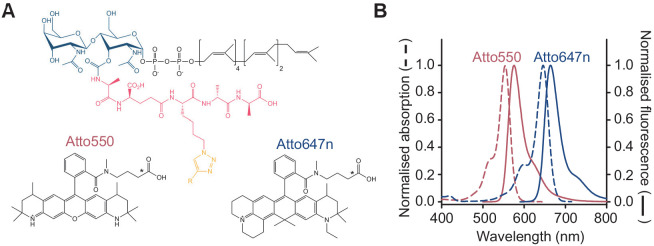
(A) Chemical structures of lipid II analogues used for the Förster resonance energy transfer assay. R corresponds to Atto550n (donor) or Atto647n (acceptor) in the corresponding analogue. The chemical structures of alkyne versions of Atto550 and Atto647n probes that were used for derivatization are not published. Therefore, the carboxylic variants are depicted here with an asterisk indicating where the alkyne versions diverge. (B) Absorbance (dashed lines) and fluorescence emission (solid lines) spectra for Atto550 (red lines) and Atto647n (blue lines).
Figure 1—figure supplement 2. Analysis of fluorescence spectra to calculate Förster resonance energy transfer (FRET) efficiency.

Figure 1—figure supplement 2.

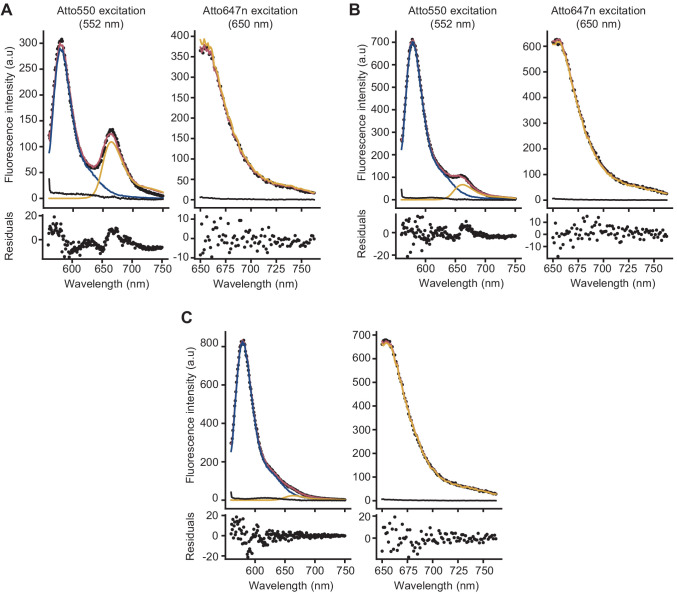
Examples of deconvolution of the fluorescence spectra of peptidoglycan samples prepared in the presence of lipid II-Atto550, Lipid II-Atto647n, and unlabelled lipid II, obtained from a reaction without antibiotics (A) or in the presence of ampicillin (B) or moenomycin (C). FRET efficiencies were calculated using the (ratio)A method, in which the enhancement of emission of the acceptor due to the donor is calculated by comparing the emission of (only) the acceptor when exciting at the donor excitation with the emission of the acceptor when exciting only the acceptor (Vámosi and Clegg, 1998). For this, two spectra were taken for every sample, either exciting at 552 nm (donor excitation) or at 650 nm (acceptor excitation). To process the spectra and separate the emission of the acceptor from that of the donor in the spectra taken at the donor excitation, reference spectra were measured from (1) reactions containing lipid II-Atto550 and unlabelled lipid II (donor reference), (2) reactions containing lipid II-Atto647n and unlabelled lipid II (acceptor references at both excitation wavelengths), and (3) reactions containing only unlabelled lipid II (background references at both excitation wavelengths). Reference samples were prepared for every antibiotic condition measured. The reference spectra were then used to analyse the spectrum containing both donor and acceptor probes (black dots). Spectra taken with donor excitation were deconvolved into three components: donor (blue), acceptor (yellow), and background (black), while the spectrum taken with acceptor excitation was deconvolved into two components: acceptor (yellow) and background (black). The fitted spectra are shown in red, and the residuals of the fit are shown below each spectrum.
Figure 1—figure supplement 2—source data 1. Numerical data to support graphs in Figure 1—figure supplement 2.
Figure 1—figure supplement 3. Förster resonance energy transfer assay to monitor peptidoglycan synthesis in real time.

Figure 1—figure supplement 3.

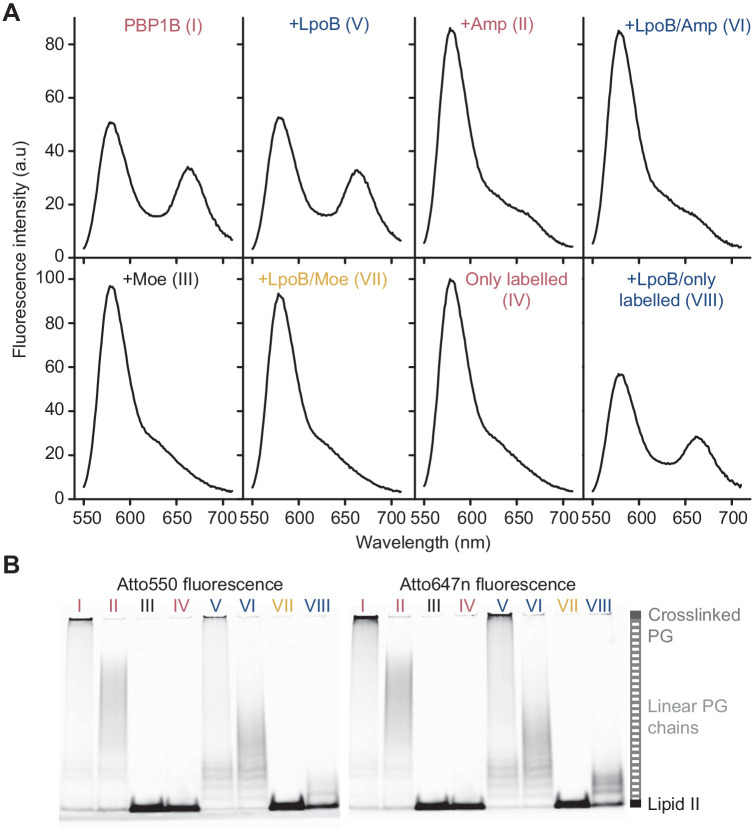
(A) Fluorescence emission spectra taken at the end (t = 1 hr) of the reactions of E. coli PBP1B shown in Figure 1E (t = 60 min). (B) Aliquots at the end of the reactions shown in Figure 1E were boiled and analysed by SDS-PAGE using fluorescence detection, and lanes are labelled with the reaction numbers as in Figure 1E.
Figure 1—figure supplement 3—source data 1. Original gel images for Figure 1—figure supplement 3.
Figure 1—figure supplement 4. Fluorescence intensity (FI) of lipid II-Atto550 and lipid II-Atto647n only changes significantly during reactions when both versions are present.

Figure 1—figure supplement 4.

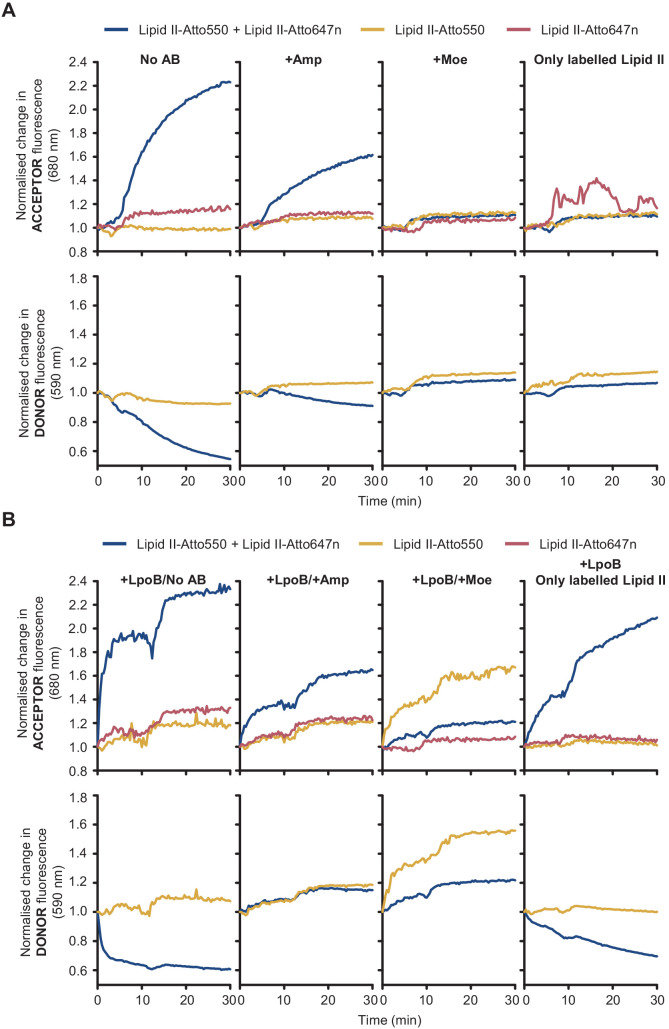
FI at the acceptor and donor emission wavelengths (590 and 680 nm, respectively) only changed significantly when there was peptidoglycan synthesis activity, and both lipid II-Atto647n and lipid II-Atto550 were added to reactions. Moreover, these changes were indicative of Förster resonance energy transfer (decrease at the donor wavelength and increase at the acceptor wavelength). (A) PBP1BEc reactions in the presence of unlabelled lipid II plus different combinations of labelled substrates (lipid II-Atto550, yellow; lipid II-Atto647n, red; or a mixture of both, blue) were monitored in real time by measuring FI at 590 nm (bottom row) and 680 nm (top row). Reactions without lipid II-Atto550 were monitored at 680 nm only. Reactions were performed at four conditions (left to right): with no antibiotics, with 1 mM ampicillin, with 100 µM moenomycin, or omitting unlabelled lipid II. Changes in FI were normalized by calculating the ratio FI(ti)/FI(t = 0). (B) Same reactions as in A, but performed in the presence of activator LpoB. In both A and B, the final concentration of each labelled lipid II was 5 µM and the total concentration of lipid II (labelled plus unlabelled) was made 15 µM by adding unlabelled lipid II.
Figure 1—figure supplement 4—source data 1. Numerical data to support graphs in Figure 1—figure supplement 4.