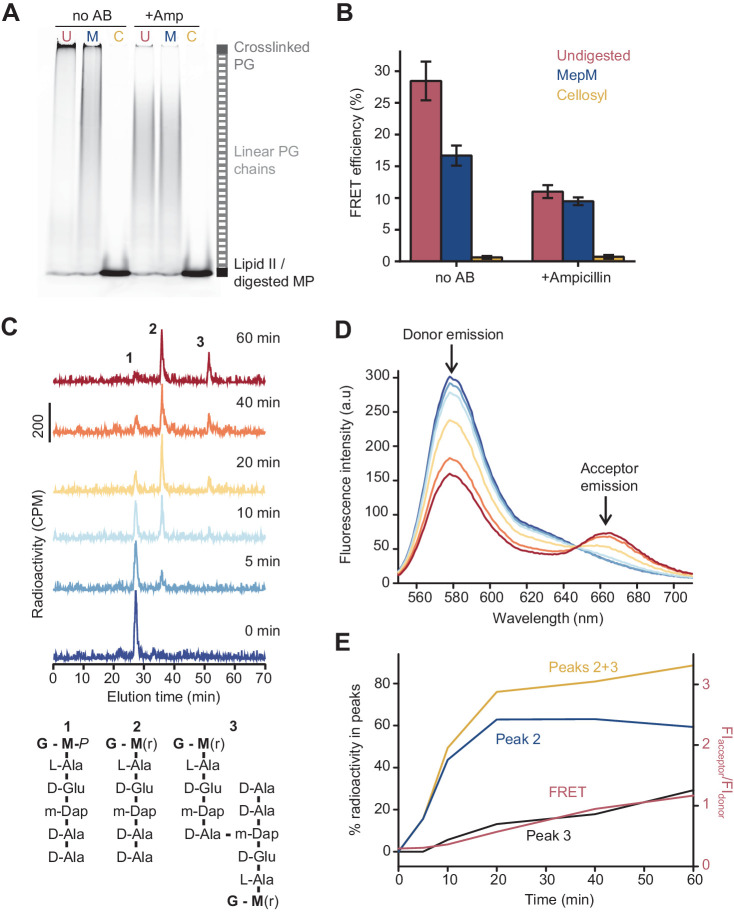
Figure 2. The Förster resonance energy transfer (FRET) signal arises from both the glycosyltransferase and transpeptidase reactions.
(A) Peptidoglycan (PG) synthesized in reactions of PBP1BEc in the presence or absence of 1 mM ampicillin was incubated with no PG hydrolase (U), DD-endopeptidase MepM (M), or muramidase cellosyl (C), and aliquots were analysed by SDS-PAGE. Reaction conditions were the same as indicated in Figure 1B–D. (B) FRET efficiency for samples prepared as indicated in A, calculated using the (ratio)A method (see Materials and methods). Values are mean ± SD of at least three independent experiments. (C) PBP1BEc (0.5 µM) was incubated with 5 µM each of lipid II-Atto647n, lipid II-Atto550, and 14C-labelled lipid II. At indicated time points, aliquots were taken and reactions were stopped by addition of moenomycin. After measuring fluorescence (see D), the PG was digested with the muramidase cellosyl, and the resulting muropeptides were reduced with sodium borohydride and separated by HPLC. The structures of muropeptides corresponding to peaks 1–3 are shown below the chromatograms. (D) Fluorescence spectra taken with excitation at 522 nm for the samples described in C. (E) Quantification of peak 2 (GTase product, blue), peak 3 (GTase+TPase, black), or the sum of both 2 and 3 (yellow) from chromatograms in C, along with the FRET signal (red) calculated as the ratio of acceptor emission over donor emission from data in D.


