. 2021 Feb 24;10:e61525. doi: 10.7554/eLife.61525

Figure 3. The Förster resonance energy transfer (FRET) assay for peptidoglycan synthesis can be adapted for reactions on liposomes.

(A) Class A penicillin-binding proteins (PBPs) were reconstituted in E. coli polar lipid (EcPL) liposomes. To assess the orientation of the liposome-reconstituted PBPs, MGC-64PBP1B-his C777S C795S containing a single cysteine in the N-terminal region was reconstituted as in A. The accessibility of the cysteine was determined by staining with sulfhydryl-reactive fluorescent probe, Alexa Fluor555-maleimide, in the presence or absence of Triton X-100 (TX). Samples were analysed by SDS-PAGE with fluorescence scanning to detect labelled protein followed by Coomassie staining. (B) To perform activity assays in liposomes, class A PBPs were reconstituted along a 1:1 molar ratio mixture of Atto550-labelled lipid II and Atto647n-labelled lipid II in liposomes as in A. Reactions were started by addition of unlabelled lipid II in the presence or absence of lipoprotein activators (lpo). Using this methodology, we monitored the activity of PBP1BEc (C, D), PBP1BAb (E, F), and PBP1BPa (G, H). Representative reaction curves are shown. Reactions were carried out in the presence (blue lines) or absence (red lines) of the lipoprotein activators (LpoB(sol) for PBP1BEc, LpoPAb(sol) for PBP1BAb, and LpoPPa(sol) for PBP1BPa), and either in the absence of antibiotic (left) or presence of 1 mM ampicillin (Amp) or 50 µM moenomycin (Moe, black and yellow lines) (middle). For PBP1BEc, control reactions in the absence of unlabelled lipid II (right) are also shown. Products were analysed by SDS-PAGE followed by fluorescence scanning at the end of reactions (right side). Curves are numbered according to the corresponding lane on the SDS-PAGE gels. PBP1BEc, PBP1BAb, and PBP1BPa were reconstituted in EcPL liposomes containing labelled lipid II (0.5 mol% of lipids, 1:1 molar ratio mixture of Atto550-labelled lipid II and Atto647n-labelled lipid II), at protein-to-lipid molar ratios of 1:3000, 1:2000, and 1:3000, respectively. Reactions were started by adding unlabelled lipid II (final concentration 12 µM) and incubated at 37°C for 60 min (PBP1BEc and PBP1BAb) or 90 min (PBP1BPa) while monitoring fluorescence at 590 and 680 nm with excitation at 522 nm. (D), (F), and (H) show averaged initial slopes from reaction curves obtained by the FRET assay for liposome-reconstituted PBP1BEc, PBP1BAb, and PBP1BPa, respectively, in the presence (blue) or absence (red) of lipoprotein activators and in the presence or absence of ampicillin. Values are normalized relative to the slope in the absence of activator and are mean ± variation of two independent experiments.

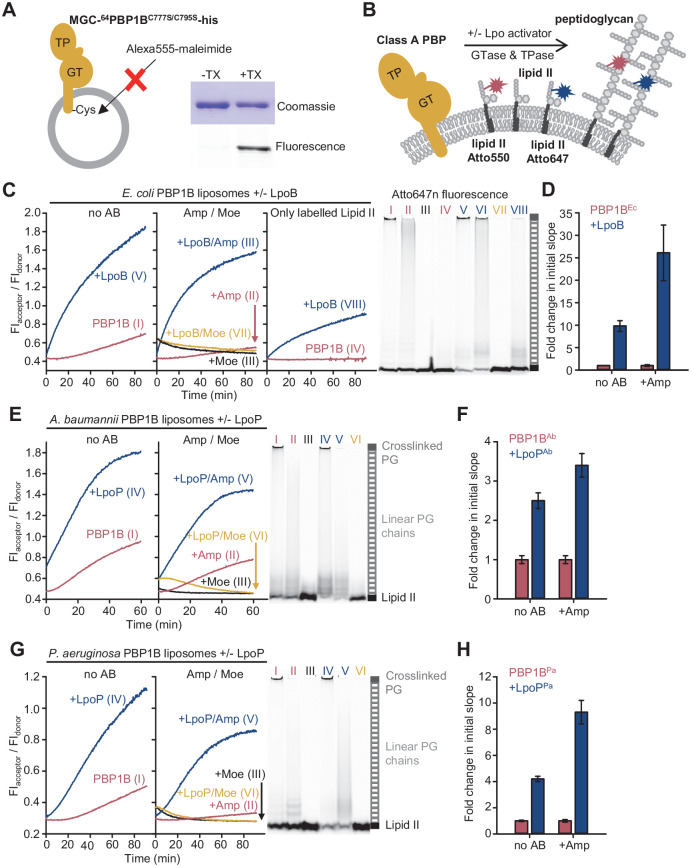
Figure 3—source data 1. Numerical data to support graphs in Figure 3 and original gel images for Figure 3C, E and G.

Figure 3.

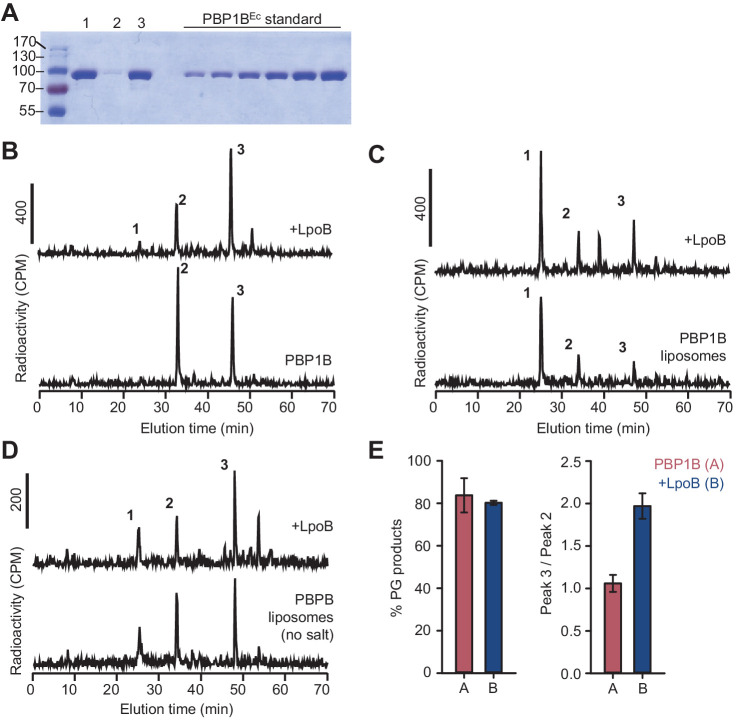
Figure 3—figure supplement 1. Activity of membrane-reconstituted PBP1BEc is optimal in E. coli polar lipids at low ionic strength.

Figure 3—figure supplement 1.

(A) Representative SDS-PAGE analysis of the reconstitution of PBP1BEc in liposomes made of E. coli polar lipids at a 1:3000 mol:mol protein:lipid ratio. After reconstitution, proteoliposome samples (lane 1) were centrifuged at low speed to remove aggregates and both pellet and supernatant samples were analysed (lanes 2 and 3, respectively). The supernatant was subsequently used for peptidoglycan (PG) synthesis reactions. A gradient of PBP1BEc (0.25, 0.41, 0.62, 0.82, 1.23, and 1.65 µg) was loaded as a standard to estimate protein concentration by densitometry. (B–D) Representative chromatograms showing the muropeptide analysis of PG produced by detergent-solubilized PBP1BEc (B) or liposome-reconstituted PBP1BEc in the presence or absence of NaCl (C and D, respectively). The concentration of PBP1BEC was 0.5 µM and, if added, that of LpoB(sol) was 2 µM LpoB(sol). The reaction buffer contained 150 mM NaCl in B and C. Samples were incubated at 37°C for 60 min in B and 90 min in C and D. The labelled peaks correspond to the muropeptides shown in Figure 1E. (E) Quantification of the total amount of radioactivity incorporated into PG (left) or the ratio between the radioactivity of peaks 3 and 2 (indicative of the degree of crosslinking of the PG, right) for activity assays for PBP1BEc in liposomes in the same conditions as in D. Values are mean ± SD (or variation) of at least two reactions.
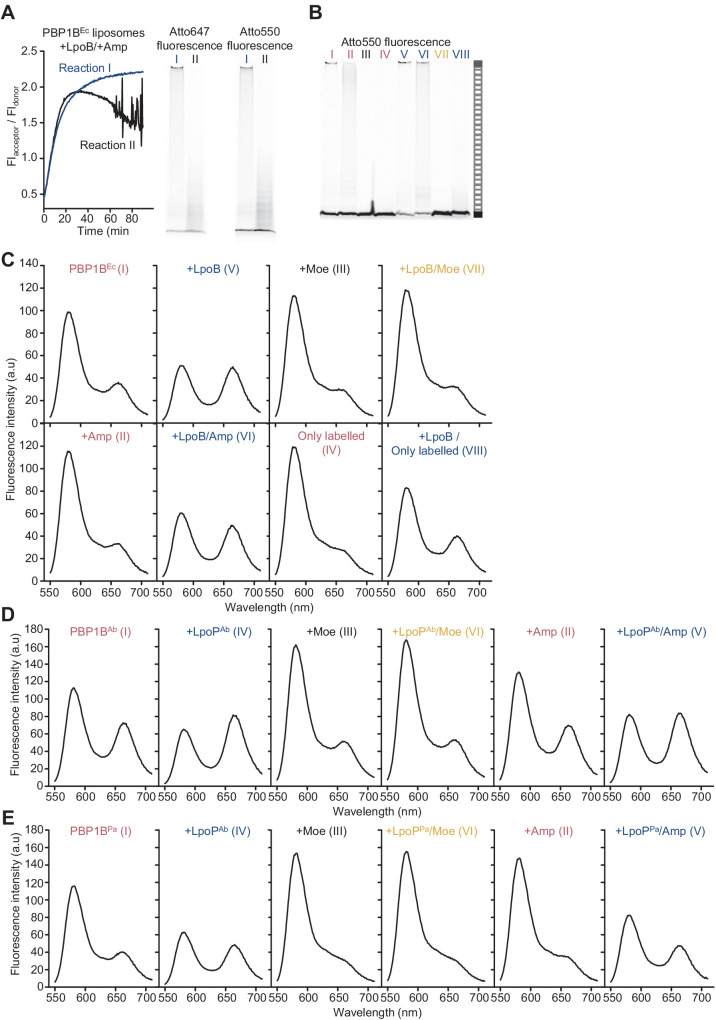
Figure 3—figure supplement 2. The Förster resonance energy transfer (FRET) assay for peptidoglycan synthesis can be adapted for reactions on liposomes.

Figure 3—figure supplement 2.

(A) Comparison of the two possible outcomes of FRET curves for reactions of PBP1BEc liposomes assayed in the presence of LpoB and ampicillin (left) and the final SDS-PAGE analysis of the same reactions (right). A third of assays in this condition resulted in curves similar to reaction I. Reaction conditions were the same as in Figure 3C. (B) The same gels depicted in Figure 3C, but scanned using the donor fluorescence (Atto550n). (C) Spectra corresponding to E. coli PBP1B reactions shown in Figure 3C, taken at t = 60 min. (D) Spectra corresponding to A. baumannii PBP1B reactions shown in Figure 3E, taken at t = 60 min. (E) Spectra corresponding to P. aeruginosa PBP1B reactions shown in Figure 3G, taken at t = 90 min.
Figure 3—figure supplement 2—source data 1. Numerical data to support graphs in Figure 3—figure supplement 2 and original gel images for Figure 3—figure supplement 2A.
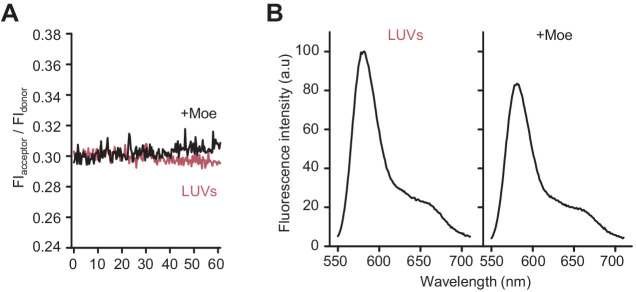
Figure 3—figure supplement 3. Moenomycin does not affect Förster resonance energy transfer (FRET) on liposomes with lipid II-Atto550 and lipid II-Atto647n in the absence of class A penicillin-binding proteins.

Figure 3—figure supplement 3.

(A) E. coli polar lipids liposomes incorporating an equimolar amount of lipid II-Atto550 and lipid II-Atto647n at 0.5% mol of the total lipid contents were incubated in the presence of 12 µM lipid II and in the presence (black line) or absence (red line) of 50 µM moenomycin for 60 min at 37°C while monitoring FRET as indicated in Materials and methods. (B) Fluorescence spectra for the samples described in A at the end of the incubation period (t = 60 min).
Figure 3—figure supplement 3—source data 1. Numerical data to support graphs in Figure 3—figure supplement 3.
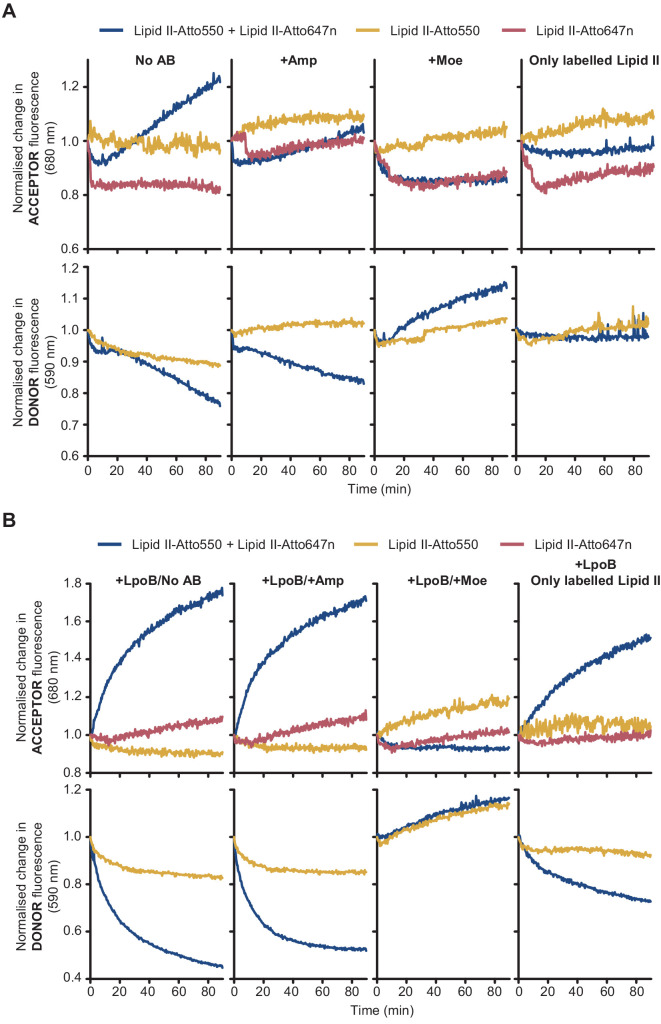
Figure 3—figure supplement 4. Fluorescence intensity (FI) of lipid II-Atto550 and lipid II-Atto647n in the membrane only changes significantly during reactions when both species are present.

Figure 3—figure supplement 4.

FI at the acceptor and donor emission wavelengths (590 and 680 nm, respectively) only changed significantly when there was peptidoglycan synthesis activity in liposomes and both lipid II-Atto647n and lipid II-Atto550 were co-reconstituted in the same liposomes. Moreover, these changes were indicative of Förster resonance energy transfer (decrease at the donor wavelength and increase at the acceptor wavelength). (A) Reactions with PBP1BEc reconstituted in liposomes along different combinations of labelled substrates (lipid II-Atto550, yellow; lipid II-Atto647n, red; or a mixture of both, blue) were monitored in real time by measuring fluorescence intensity at 590 nm (bottom row) and 680 nm (top row). Reactions with lipid II-Atto647n only were monitored at 680 nm only. Reactions were performed in four conditions (left to right): with no antibiotics, with 1 mM ampicillin, with 100 µM moenomycin, or omitting unlabelled lipid II. Changes in FI were normalized by calculating the ratio FI(ti)/FI(t = 0). (B) Same reactions as in A, but performed in the presence of activator LpoB. In both A and B, reactions were started by addition of 12 or 24 µM non-fluorescent lipid II (for reactions with both fluorescent lipid II variants or reactions with variants, respectively), except in the indicated control condition.
Figure 3—figure supplement 4—source data 1. Numerical data to support graphs in Figure 3—figure supplement 4.
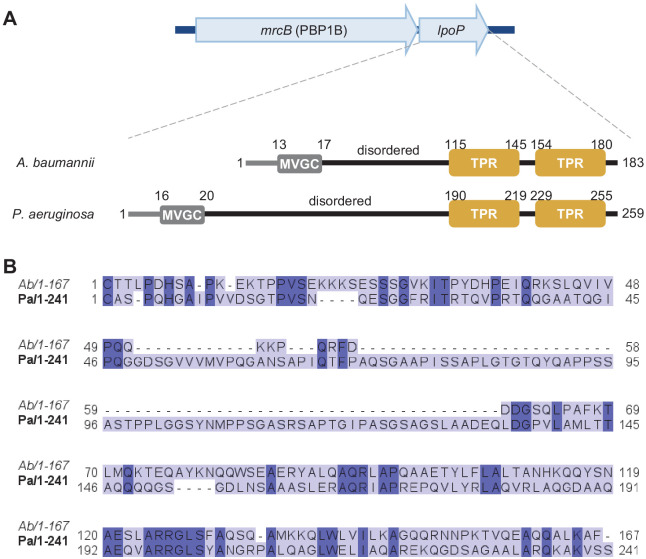
Figure 3—figure supplement 5. Amino acid sequence comparison between LpoP homologues from A.baumannii and P.aeruginosa.

Figure 3—figure supplement 5.

(A) In the genomes of A. baumannii and P. aeruginosa, the gene encoding LpoP is present within the same operon as the gene encoding their cognate PBP1B. Both LpoP proteins are predicted lipoproteins with a disordered region between the N-terminal Cys and the C-terminal globular domain containing the tetratricopeptide repeats (TPRs). LpoPAb has a shorter disordered linker than LpoPPa. (B) Sequence comparison between the globular regions of LpoPAb (Ab) and LpoPPa (Pa). Proteins sequences (minus the signal peptides) were aligned using T-COFFEE EXPRESSO, and the resulting alignment was visualized using JALVIEW. Residues conserved in both proteins are highlighted in a darker colour.
Figure 3—figure supplement 6. LpoPAb stimulates the glycosyltransferase activity of PBP1BAb.

Figure 3—figure supplement 6.

(A) Real-time glycosyltransferase activity assays using dansyl-lipid II and detergent-solubilized A. baumannii PBP1B (PBP1BAb). PBP1BAb (0.5 µM) was mixed with 10 µM dansyl-lipid II in the presence or absence of soluble 0.5 µM A. baumannii LpoP (LpoPAb(sol)). A control was performed by adding 50 µM moenomycin (black). Each data point represents mean ± SD of three independent experiments. (B) Averaged initial slopes from reaction curves in A. Values are normalized relative to the slope in the absence of activator and are mean ± SD of three independent experiments. (C) Time-course GTase assay by SDS-PAGE followed by fluorescence detection. Detergent-solubilized PBP1BAb was incubated with 5 µM lipid II-Atto550 and 25 µM unlabelled lipid II in the presence or absence of 1.5 µM LpoPAb(sol). Reactions contained 1 mM ampicillin to block transpeptidation. Aliquots were taken at the indicated times (in min), boiled, and analysed by SDS-PAGE. A control in which only LpoPAb(sol) was present is also shown.
Figure 3—figure supplement 6—source data 1. Numerical data to support graphs in Figure 3—figure supplement 6.
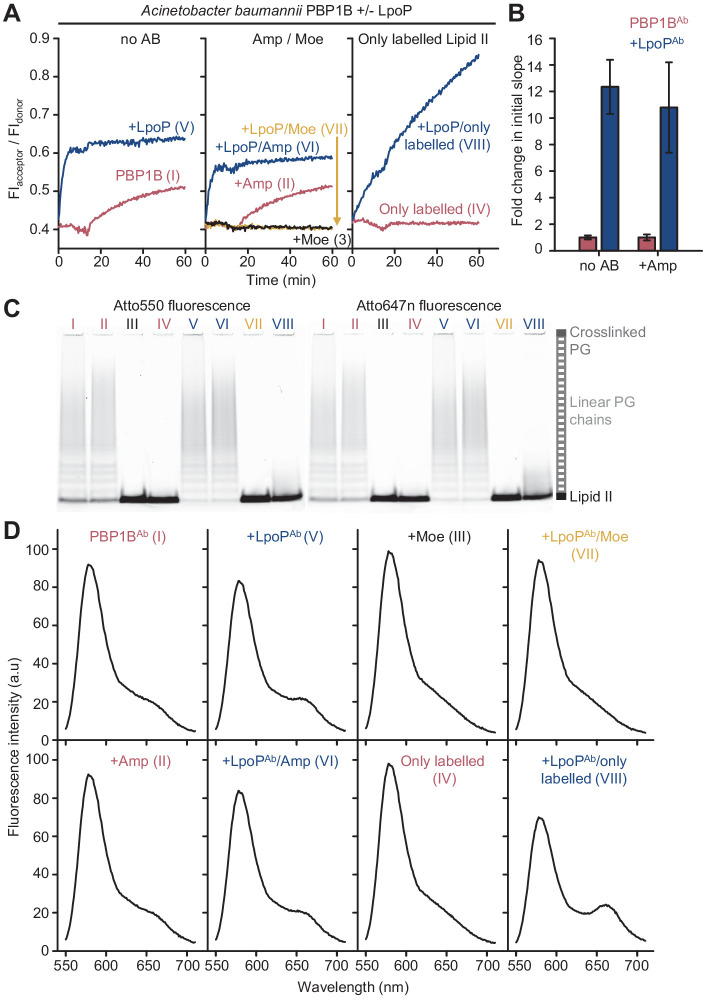
Figure 3—figure supplement 7. Peptidoglycan synthesis activity of A.baumannii PBP1B in the presence of Triton X-100 followed by Förster resonance energy transfer (FRET).

Figure 3—figure supplement 7.

(A) Representative FRET curves for activity assays using detergent-solubilized A. baumannii PBP1B (PBP1BAb). PBP1BAb (0.5 µM) was mixed with unlabelled lipid II, Atto550-labelled lipid II, and Atto647n-labelled lipid II at a 1:1:1 molar ratio (5 µM of each) in the presence or absence of 2 µM soluble A. baumannii LpoP (LpoPAb(sol)). Controls were performed by adding 50 µM moenomycin in the absence (black) or presence (yellow) of LpoPAb(sol). Reactions were performed without antibiotic (left), with 1 mM ampicillin (middle), or in the absence of unlabelled lipid II (right). The numbers indicate the corresponding lane of the gel in C. Samples were incubated for 60 min at 30°C. (B) Averaged initial slopes from reaction curves obtained by the FRET assay for detergent-solubilized PBP1BAb in the presence (blue) or absence (red) of LpoP and in the presence or absence of ampicillin. Values are normalized relative to the slope in the absence of activator for each condition and are mean ± SD of two independent experiments. (C) Aliquots after reactions in A were boiled and analysed by SDS-PAGE followed by fluorescence detection. (D) Fluorescence emission spectra taken after reactions in A (t = 60 min).
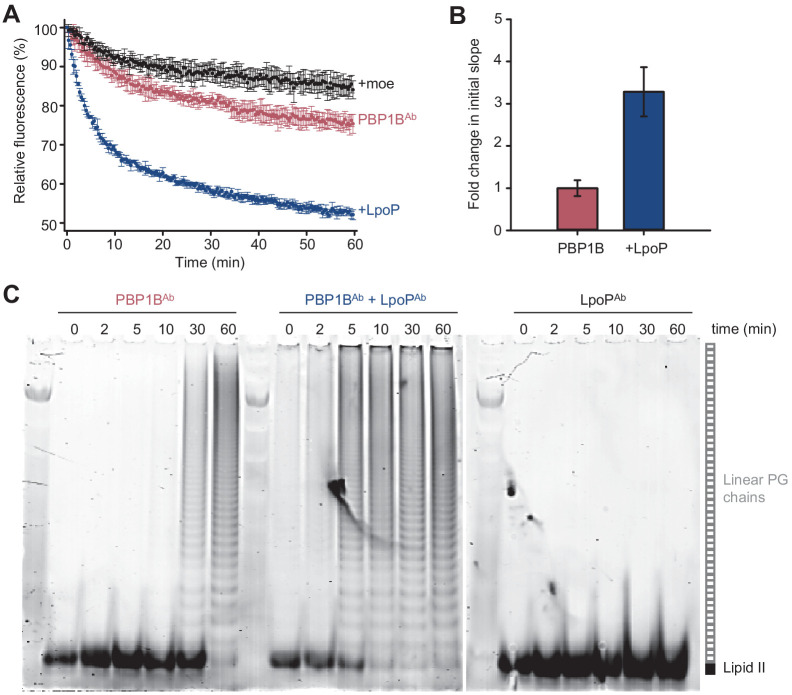
Figure 3—figure supplement 7—source data 1. Numerical data to support graphs in Figure 3—figure supplement 7 and original gel images for gels in Figure 3—figure supplement 7C.
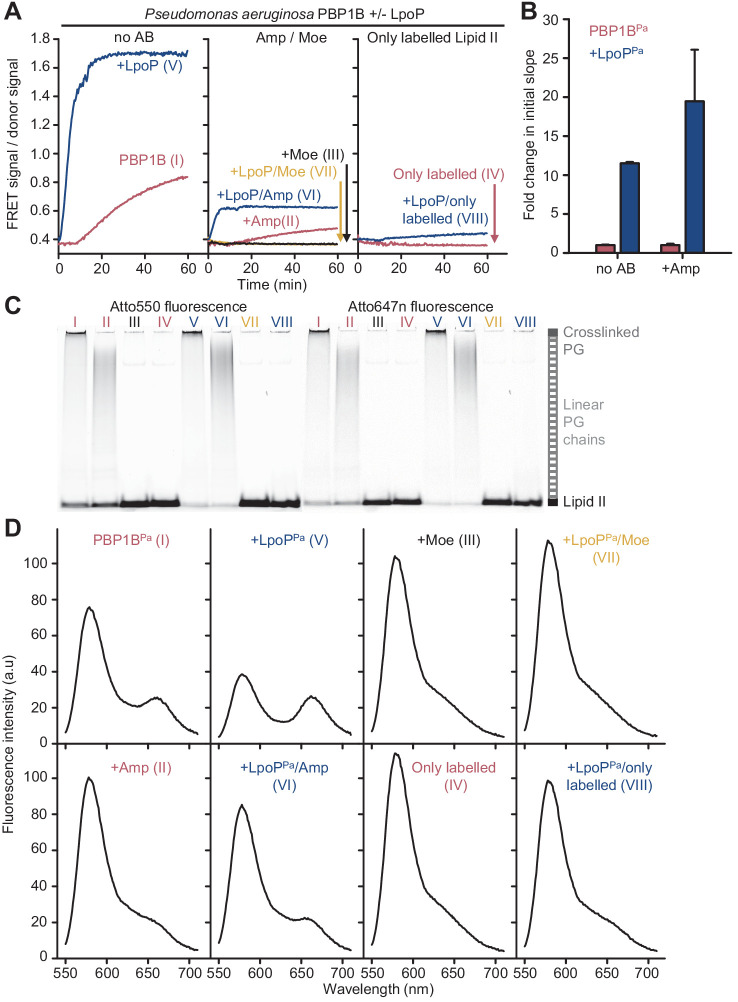
Figure 3—figure supplement 8. Peptidoglycan synthesis activity of P. aeruginosa PBP1B in the presence of Triton X-100 followed by Förster resonance energy transfer (FRET).

Figure 3—figure supplement 8.

(A) Representative FRET curves for activity assays using detergent-solubilized P. aeruginosa PBP1B (PBP1BPa). PBP1BPa (0.5 µM) was mixed with unlabelled lipid II, Atto550-labelled lipid II, and Atto647n-labelled lipid II at a 1:1:1 molar ratio (5 µM of each) in the presence or absence of 2 µM soluble P. aeruginosa LpoP (LpoPPa (sol)). Controls were performed by adding 50 µM moenomycin in the absence (black) or presence (yellow) of LpoPPa(sol). Reactions were performed without antibiotic (left), with 1 mM ampicillin (middle), or in the absence of unlabelled lipid II (right). The numbers indicate the corresponding lane of the gel in C. Samples were incubated for 90 min at 37°C. (B) Averaged initial slopes from reaction curves obtained by the FRET assay for detergent-solubilized PBP1BPa in the presence (blue) or absence (red) of LpoP and in the presence or absence of ampicillin. Values are normalized relative to the slope in the absence of activator for each condition and are mean ± SD of 2–3 independent experiments. (C) Aliquots after reactions in A were boiled and analysed by SDS-PAGE followed by fluorescence detection. (D) Fluorescence emission spectra taken after reactions in A (t = 90 min).
Figure 3—figure supplement 8—source data 1. Numerical data to support graphs in Figure 3—figure supplement 8 and original gel images for gels in Figure 3—figure supplement 8C.