. 2021 Mar 3;18(2):133–146. doi: 10.21873/cgp.20248

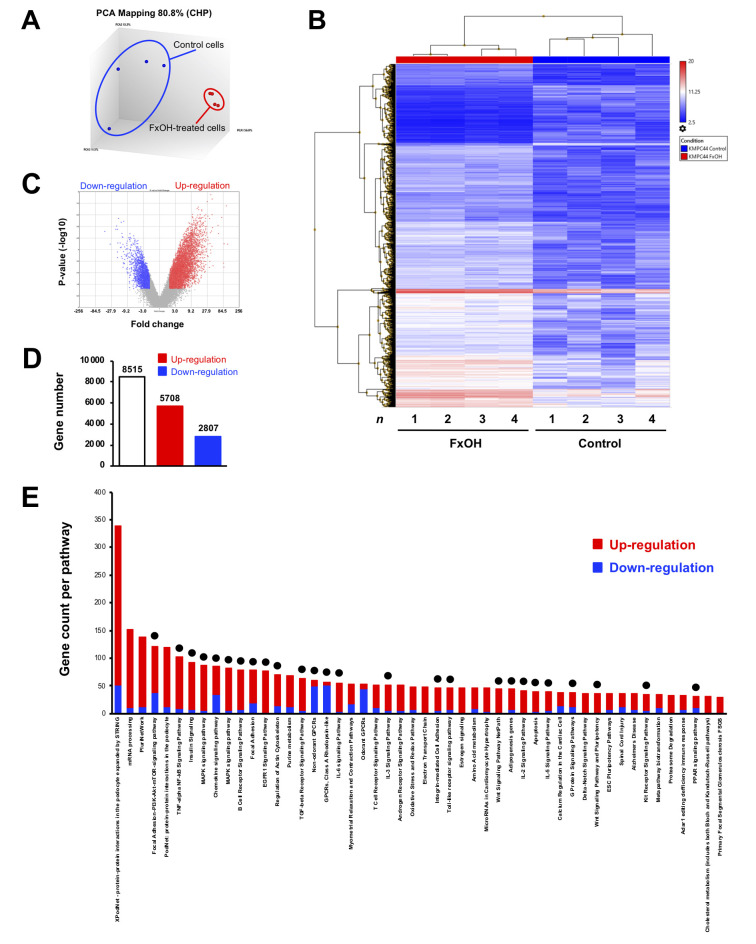
Figure 2. Gene expression profiles in KMPC44 cells with or without fucoxanthinol (FxOH) treatment. KMPC44 cells were treated with 5 μM FxOH for 1 day. Gene expression levels between FxOH-treated KMPC44 cells and control cells were subjected to Clariom S human arrays and TAC software (n=4). Significant differences in gene expression levels, ≥2.0 and ≤-2.0 -fold with cutoff p-value (p<0.05), FxOH-treated KMPC44 cells and control cells are shown using the average value in quadruplicate. (A) PCoA plots on gene distance between the two groups. (B) Hierarchical clustering analysis for 8,515 genes between the two groups. (C) Volcano plots between the two groups. (D) Total number of up- (≥2.0-fold), and down-regulated (≤-2.0-fold) genes between the two groups. (E) The distribution of the top 50 gene sets altered between the two groups. Red, upregulated genes. Blue, down-regulated genes. Black circle, gene sets regarding growth and inflammation.

Figure 2